Helpshift - Agent Analytics
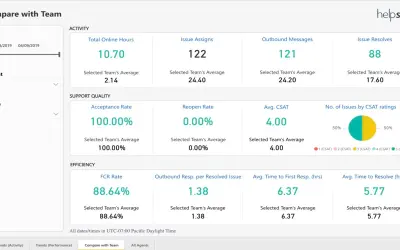
Agent Analytics for Helpshift provides activity, support quality, and efficiency metrics including CSAT and First Response Time.
HelpshiftPaidCompare
2531 analytics apps for Microsoft 365
Agent Analytics for Helpshift provides activity, support quality, and efficiency metrics including CSAT and First Response Time.
Helpshift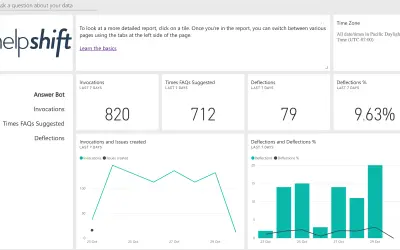
Reports metrics for Helpshift's QuickSearch Bot and Custom Bot, such as invocations, FAQs, deflection rate, and assignments.
Helpshift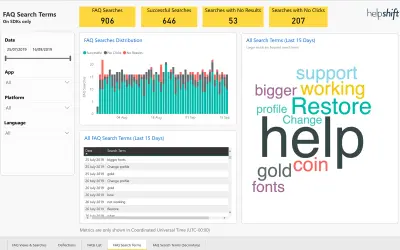
Enables Helpshift customers to slice and dice FAQ metrics and gain actionable insights into their FAQ performance.
Helpshift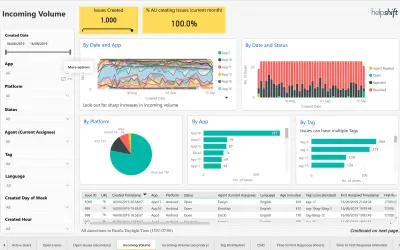
Helpshift Support Analytics provides dashboards and reports on CSAT, response times, and backlog trends for Helpshift.
Helpshift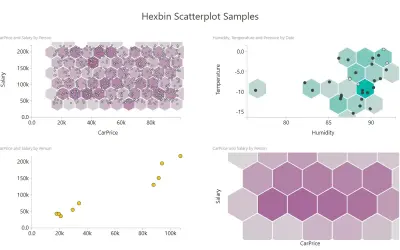
Custom Microsoft Power BI visual that overlays scatterplot points on hexagonal bins, with bin color showing point density.
David Eldersveld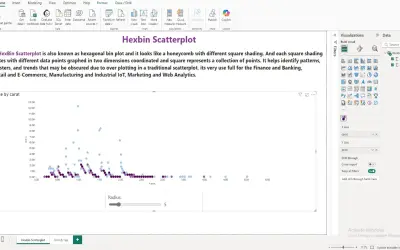
A Power BI visual that divides the data space into hexagonal bins to reduce overlap and visual clutter in large datasets.
iFour Technolab Pvt. Ltd.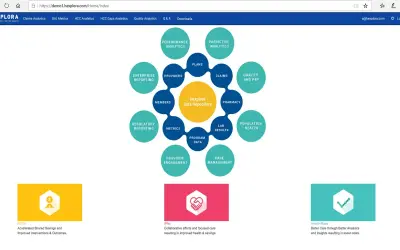
Hexplora delivers cloud-based data management, quality metrics, and predictive modeling for Azure and Power BI environments.
Hexplora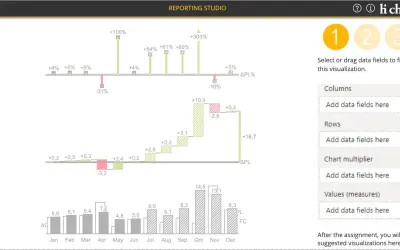
Creates charts, tables and waterfalls in Power BI with a built-in notation concept and automatic variance calculation.
CP Corporate Planning GmbH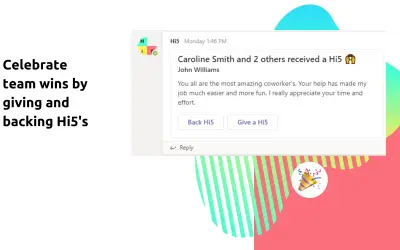
Hi5 enables managers and peers to give and receive recognition and view team performance reports within Microsoft Teams.
Hi5 Technologies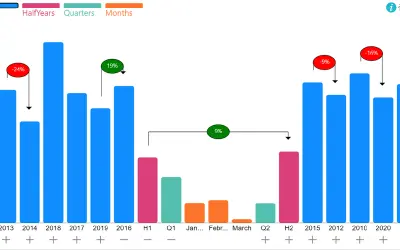
Power BI custom visual offering variance display, drag-based sorting, legend drill-down, and targets for hierarchical data.
Excelnaccess.com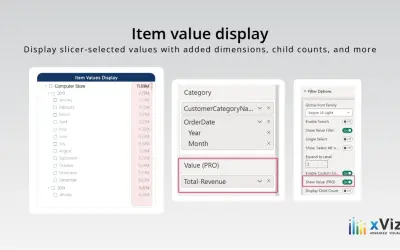
Hierarchical slicer for Power BI that filters values with search, conditional formatting, and expandable parent-child nodes.
xViz LLC dba Lumel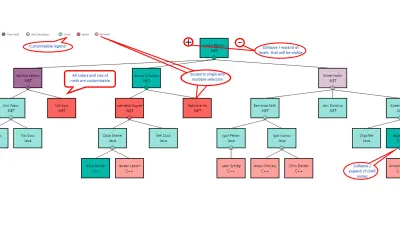
Hierarchy Chart by Akvelon displays hierarchical data such as organizational structures and genealogy within Power BI.
Akvelon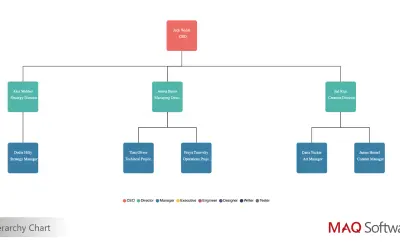
Hierarchy Chart by MAQ Software renders organizational and functional data as top-down tree diagrams with interactive cards.
MAQ LLC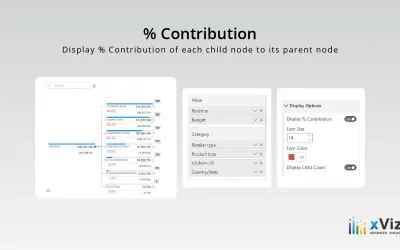
Hierarchy Tree - xViz breaks down categories and dimensions into detailed levels for reporting in Power BI.
xViz LLC dba Lumel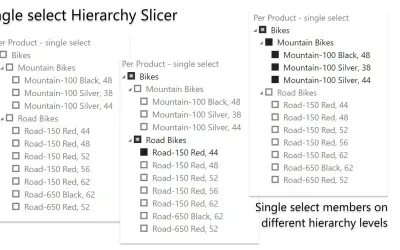
HierarchySlicer is a Power BI visual that filters report items using expandable or collapsible ad-hoc or pre-defined hierarchies.
DataScenarios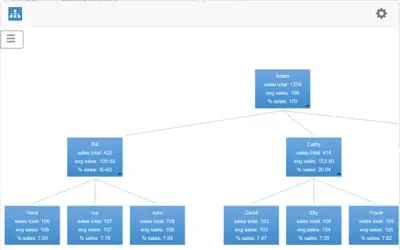
Visualizes hierarchies and computes roll-ups (total, average, min/max, or a custom formula) at each hierarchy level.
Appuccino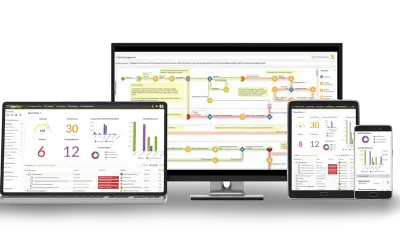
HighGear enables business users to assign tasks, manage work, and track progress in real-time across dozens of departments.
Swift Software, Inc.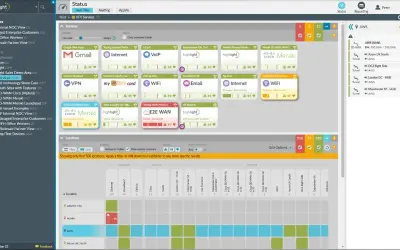
Highlight Service Assurance Platform provides visibility, alerting and reporting for multi-tenant, multi-vendor managed networks.
Highlight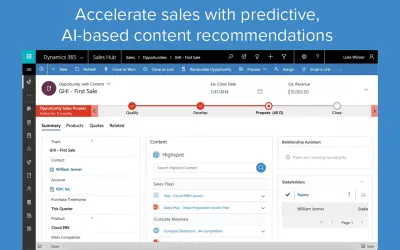
Highspot integration for Microsoft Dynamics 365 that recommends content, auto-logs activities, and provides training in-app.
Highspot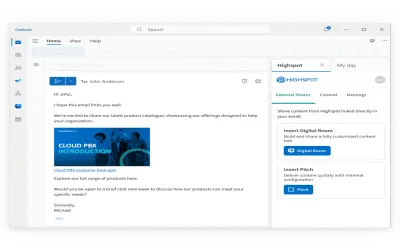
Provides Highspot AI search, content discovery, and engagement analytics within Outlook for Highspot customers.
Highspot, Inc.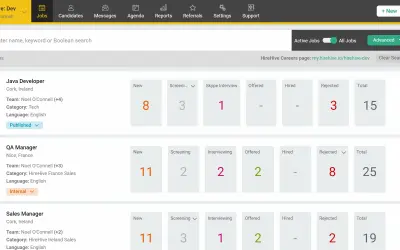
HireHive posts jobs to job boards and social channels, manages candidate pipelines, and translates application pages.
HireHive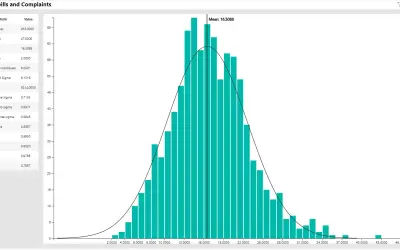
Histogram chart for Power BI that shows central location, spread, and shape of data along with capability indices.
PQ Systems