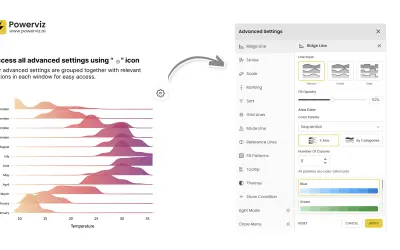
Ridgeline Plot by Powerviz
Custom Power BI visual that plots numeric distributions for multiple categories as stacked curves along a common continuous axis.
TRUVIZ INCFree
Analyzes relationships and data density between two numerical variables in Power BI using hexagonal bins.
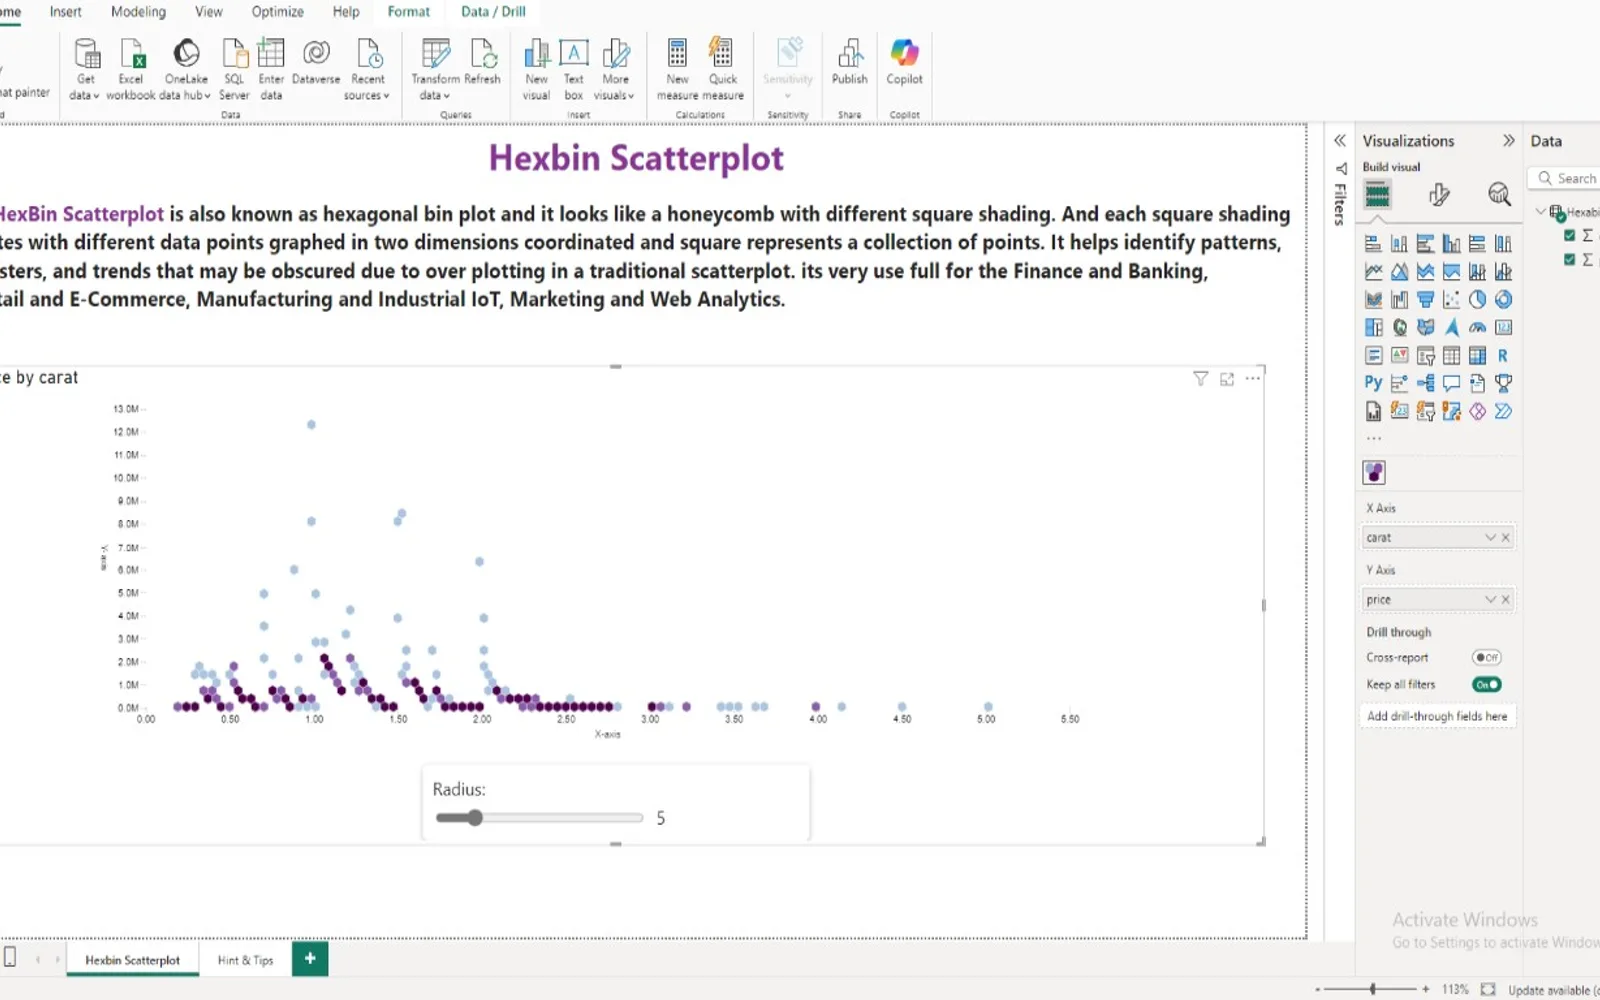
The visual divides data points into hexagonal areas to show density and reduce overlap. Bin size can be adjusted, with color gradients and legends used to represent concentration. Clusters and outliers can be annotated, while tooltips provide details for individual hexagons.
Groups data points into hexagonal areas to represent density and reduce visual overlap.
Allows hexagon size to be changed between finer detail and a simpler chart.
Uses color scales and a legend to represent the density of data points.
Supports annotations for clusters and outliers.
Displays detailed information when hovering over hexagons.
Hexbin Scatterplot by iFour is a paid, cloud-deployed Power BI add-in updated on Sep 2025. Ridgeline Plot by Powerviz is free and cloud-deployed, with an update date of Jul 2026. Dual Y-Axis Combo Chart (Pro) for Power BI is freemium and cloud-deployed, with an update date of Feb 2026, while Multi Line Chart with Tooltips is paid and cloud-deployed, with an update date of Jan 2025.
| Name | Pricing | Deployment | Updated |
|---|---|---|---|
| this plugin | Paid | Cloud | |
| Hexbin Scatterplot | Paid | Cloud | |
| Ridgeline Plot by Powerviz | Free | Cloud | |
| Dual Y-Axis Combo Chart (Pro) for Power BI | Freemium | Cloud | |
| Multi Line Chart with Tooltips | Paid | Cloud |
657 plugins in Power BI · Analytics
Price distribution: 73 free, 108 freemium, 441 paid, 35 price not published
Custom Power BI visual that plots numeric distributions for multiple categories as stacked curves along a common continuous axis.
TRUVIZ INC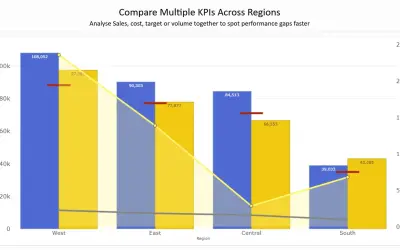
Combines column, line, area, and scatter charts on dual Y-axes to compare up to 8 metrics in a single Power BI visual.
PBIVizEdit.com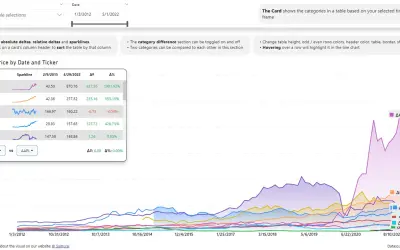
Power BI visual that compares categories over time, with YoY, MoM, YTD and MTD calculations, deltas and sparklines.
Datanauts
Gantt Chart is a project management visual for Microsoft Power BI that tracks schedules, milestones, and resource workloads.
ChartPad«A Hexbin Scatterplot is a powerful visualization technique for analyzing relationships between two numerical variables and identifying data density. It works by dividing the data space into hexagonal bins, reducing overlap and visual clutter Best Practices for Using Hexbin Scatterplot Choose the Right Bin Size: Adjust …»