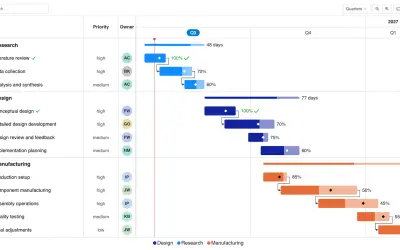
Gantt Chart
Gantt Chart is a project management visual for Microsoft Power BI that tracks schedules, milestones, and resource workloads.
ChartPadFree
Measures support-agent activity, quality, and efficiency in Power BI.
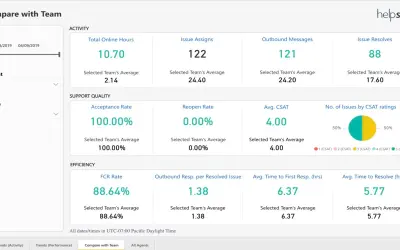
Provides reports for agent-team performance and individual agent performance in Power BI. The reports cover work volume, support quality, and response and resolution measures.
Includes counts for resolved issues and issue touches.
Includes CSAT and reopened-issue rate.
Includes first-response time, resolution time, and first-contact resolution rate.
2,531 plugins in Power BI · Analytics
Price distribution: 125 free, 147 freemium, 1,350 paid, 909 price not published
Gantt Chart is a project management visual for Microsoft Power BI that tracks schedules, milestones, and resource workloads.
ChartPad
Creates visualizations from diverse chart types, combines multiple charts on one canvas, and adds custom annotations and tooltips.
Akvelon
Creates financial and business reports in Power BI with automatic variance calculations, P&L logic, and drill-down (s5, s6).
Zebra BI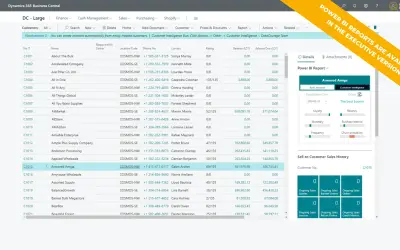
AI analysis app for Dynamics 365 Business Central that provides customer KPIs, churn probability, and customer grouping.
Data Courage«Helpshift Agent Analytics offers insights into your overall Agent Team performance and at the individual Agent level. The report provides Activity Metrics such as Issues Resolved, Issue Touches, and Support Quality Metrics such as CSAT and Reopen Rate. It also includes Efficiency Metrics such as First Response Time …»