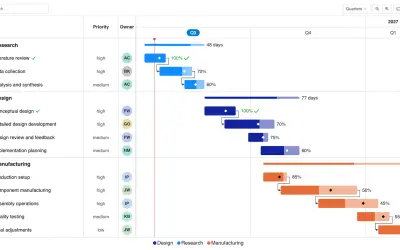
Gantt Chart
Gantt Chart is a project management visual for Microsoft Power BI that tracks schedules, milestones, and resource workloads.
ChartPadFree
Analyzes customer support data in Power BI through dashboards and reports on CSAT, response times, resolution times, volume, and backlog.
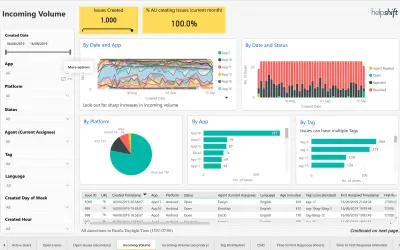
Provides a dashboard overview and detailed reports for customer support data in Power BI. Reports cover CSAT, response times, resolution times, volume, and backlog trends. Metrics can be analyzed by app name, platform, agent, tags, and languages.
Provides an overview dashboard for customer support analytics.
Provides detailed reports for analyzing customer support metrics.
Covers CSAT, response times, resolution times, volume, and backlog trends.
Allows metrics to be isolated by app name, platform, agent, tags, and languages.
Customer support managers.
2,531 plugins in Power BI · Analytics
Price distribution: 125 free, 147 freemium, 1,350 paid, 909 price not published
Gantt Chart is a project management visual for Microsoft Power BI that tracks schedules, milestones, and resource workloads.
ChartPad
Creates visualizations from diverse chart types, combines multiple charts on one canvas, and adds custom annotations and tooltips.
Akvelon
Creates financial and business reports in Power BI with automatic variance calculations, P&L logic, and drill-down (s5, s6).
Zebra BI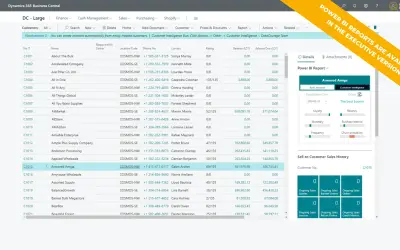
AI analysis app for Dynamics 365 Business Central that provides customer KPIs, churn probability, and customer grouping.
Data Courage«Helpshift Support Analytics offers comprehensive insights for customer support managers by providing the necessary data to optimize the support experience for your users. These analytics include an easy-to-understand dashboard overview as well as detailed reports. With this report, you will be able to efficiently …»