graphomate bubbles
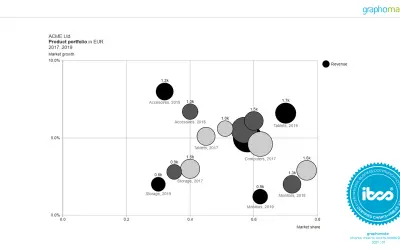
graphomate bubbles provides bubble charts, scatterplots, and portfolio analyses with two value axes for Microsoft Power BI.
graphomateFreeCompare
2531 analytics apps for Microsoft 365
graphomate bubbles provides bubble charts, scatterplots, and portfolio analyses with two value axes for Microsoft Power BI.
graphomate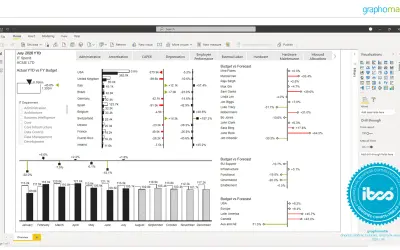
An IBCS-certified charting component providing six standardized chart types and deviation analysis for Microsoft Power BI.
graphomate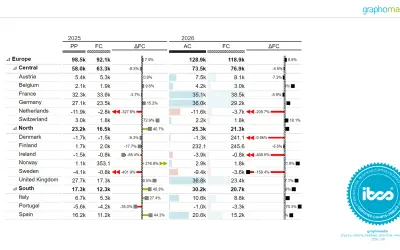
A table component for Power BI, Microsoft Office, Tableau, and SAP Analytics supporting IBCS rules and in-cell charts.
graphomate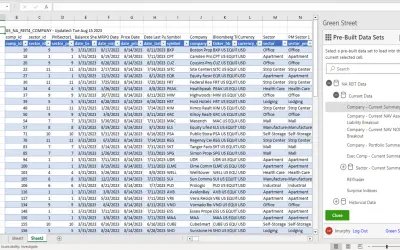
Green Street Add-In delivers real-time commercial real estate data into spreadsheet models via dynamic tables and formulas.
Green Street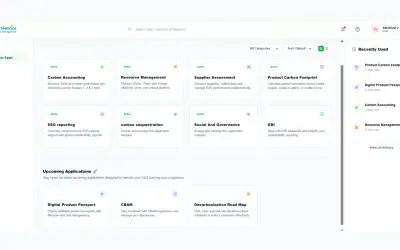
GreenMetrics ESG collects, monitors, and reports sustainability metrics across carbon emissions, energy, water, and waste.
Green Metrics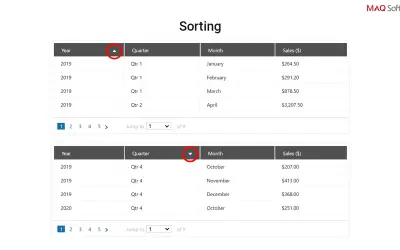
Power BI custom visual that renders large data sets in a grid with customizable pagination and sorting on any column.
MAQ LLC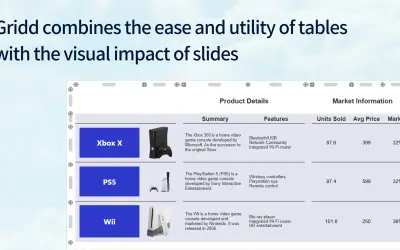
Gridd combines table editing with slide design to produce aligned, pixel-perfect presentations within PowerPoint.
GriddApp
Gruntify: Fieldwork Automation provides asset management, job scheduling, and data capture tools for mobile field service teams.
GIS PEOPLE PTY LTD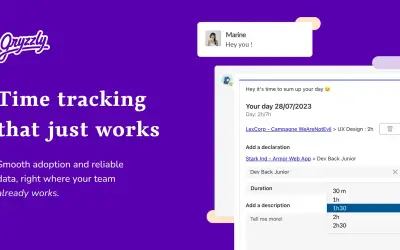
Gryzzly provides a chatbot within Microsoft Teams for logging time entries and viewing project budgets and margins in real time.
Gryzzly
Microsoft Teams app that matches mentors and mentees in an organization and guides the mentoring relationship with AI.
GUIDER GLOBAL LTD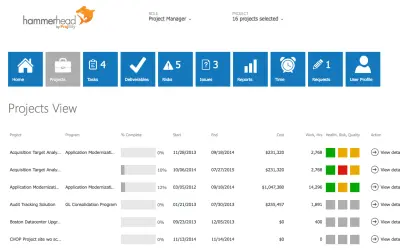
PPM data warehouse for Project Online that serves as the data hub for the PMO, with a synchronization engine keeping data fresh.
Projility
Outlook add-in that captures expense data from bills or invoices in Outlook and creates expenses on the Happay Dashboard.
VA Tech Ventures Pvt Ltd (Happay)
HappySignals measures end-user experiences across nine IT areas for enterprises on a single platform.
HappySignals Oy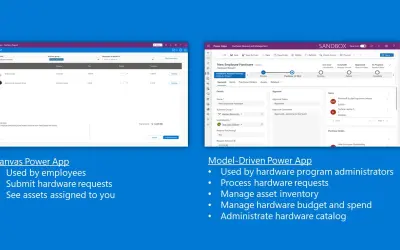
A Microsoft Power Platform template that digitizes IT hardware requests, asset management, and approvals via Teams.
Microsoft Power Platform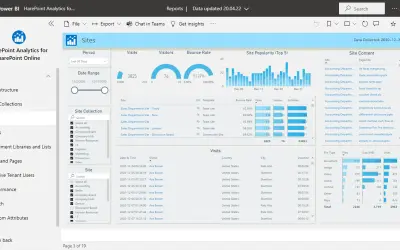
HarePoint Analytics collects, visualizes, and analyzes usage data for SharePoint Online through Power BI dashboards and reports.
MAPILab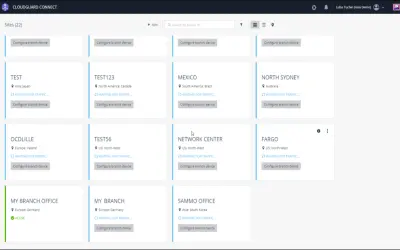
Harmony Connect secures branch-to-internet and virtual-network-to-internet connections with advanced threat prevention.
Check Point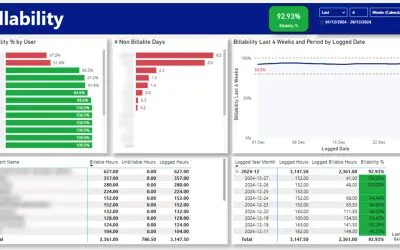
Extracts Harvest data such as logged hours, project details, and team performance metrics into Power BI for reporting.
Plainsight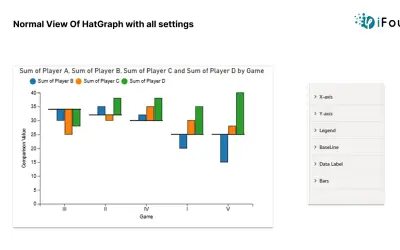
Power BI custom visual that compares values against a baseline, with configurable lines, data labels, and bar colors.
iFour Technolab Pvt. Ltd.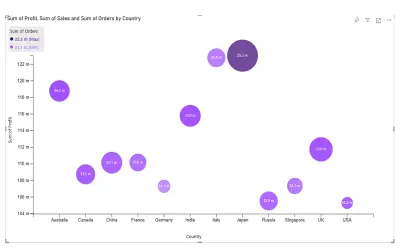
HCLTech 4-Dimensional Bubble Chart visualizes three quantitative variables simultaneously using customizable bubbles in Power BI.
hcl technologies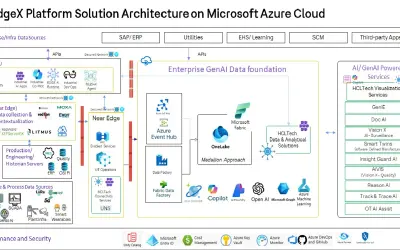
HCLTech iEdgeX unifies OT, IT, and engineering data to deploy and scale AI across industrial edge and cloud environments.
HCL America Inc_HCLT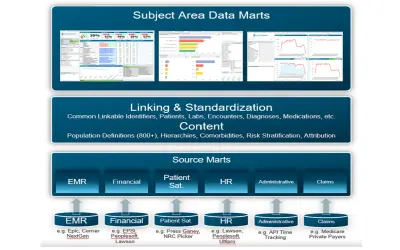
Health Catalyst Data Operating System provides an agile, flexible adaptive data model built on a late-binding bus architecture.
Health Catalyst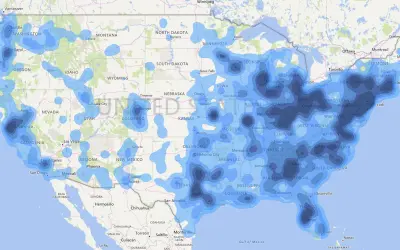
Aggregates data points locally and maps them to gradient or quantile colors to convey data density for Power BI.
Weiwei Cui