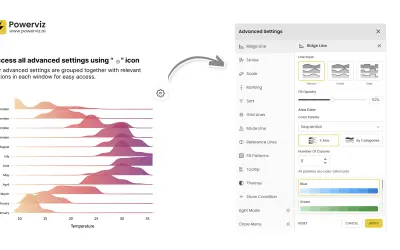
Ridgeline Plot by Powerviz
Custom Power BI visual that plots numeric distributions for multiple categories as stacked curves along a common continuous axis.
TRUVIZ INCFree
Create customizable histogram visuals in Microsoft Power BI with dynamic bins, reference lines, small multiples, and conditional colors.
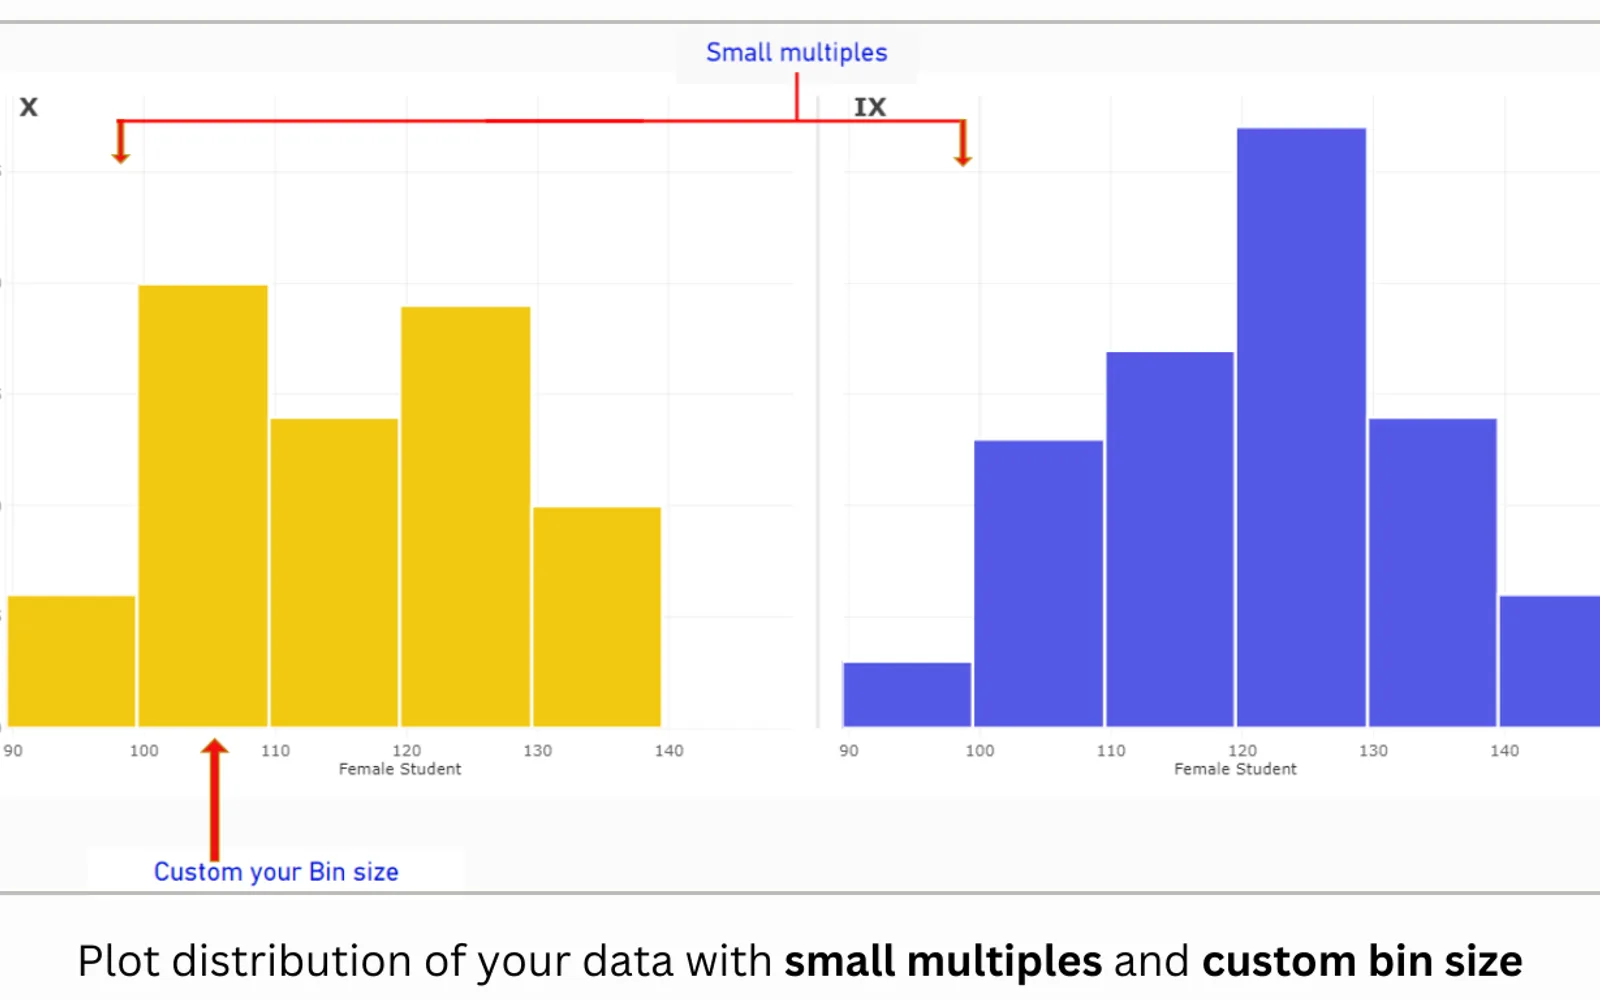
This Power BI visual creates histograms with customizable or dynamic bin sizes. It supports reference lines and bands, small multiples, weighting by measures, conditional colors, and sorting. The visual can display value, percentage, probability, cumulative, stacked, and clustered histograms. It does not access external services or resources and is not certified by the Microsoft Power BI team.
Histogram bins can use custom sizes or dynamic sizing.
The analytics panel provides reference lines and reference bands.
The visual supports small multiple, also called trellis, layouts.
Values can be weighted using measures such as average, minimum, or maximum.
The visual supports conditional color formatting.
Available variations include value, percentage, probability, cumulative, stacked, and legend or clustered histograms.
This listing uses a freemium pricing model and cloud deployment. Ridgeline Plot by Powerviz is free, while Lollipop Column Chart, Bullet Chart - xViz, and Innofalls Charts are freemium; Multi Line Chart with Tooltips is paid. The listing was updated on Dec 2025, compared with alternative update dates of Jul 2026, Aug 2026, Dec 2025, Dec 2025, and Jan 2025.
| Name | Pricing | Deployment | Updated |
|---|---|---|---|
| this plugin | Freemium | Cloud | |
| Ridgeline Plot by Powerviz | Free | Cloud | |
| Lollipop Column Chart | Freemium | Cloud | |
| Bullet Chart - xViz | Freemium | Cloud | |
| Innofalls Charts | Freemium | Cloud | |
| Multi Line Chart with Tooltips | Paid | Cloud |
877 plugins in Power BI · Analytics
Price distribution: 74 free, 113 freemium, 497 paid, 193 price not published
Custom Power BI visual that plots numeric distributions for multiple categories as stacked curves along a common continuous axis.
TRUVIZ INC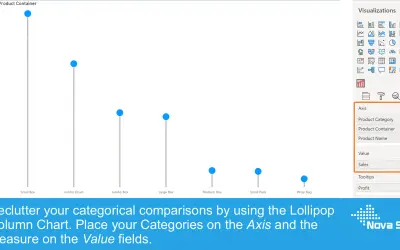
Lollipop Column Chart displays a marker and line per category as an alternative to standard column charts in Power BI.
Nova Silva
Power BI visual for comparing actuals against targets, with IBCS-certified bullet chart templates and comparison bands.
xViz LLC dba Lumel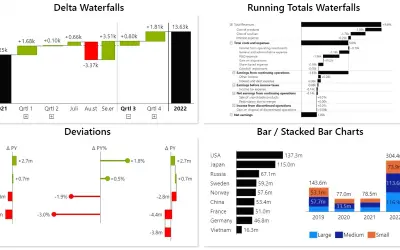
Power BI visual for building waterfall and bar charts through interactive navigation, drill downs, and dynamic comparisons.
Innofalls GmbH«This visual is not certified by Microsoft Power BI team. If you want the certified version of this visual, please check Histogram Chart (Pro). Please note all our Pro visuals can be exported to PPT/PDF. All of our visuals, including those not certified by Microsoft, do not access any external services or resources and …»