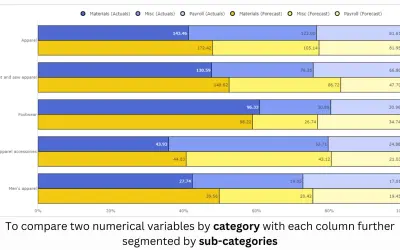
100% Clustered Stacked Bar Chart (Pro)
100% Clustered Stacked Bar Chart (Pro) renders conditional formatting and small multiples for Power BI reports.
PBIVizEdit.comFreemiumCompare
147 analytics apps for Microsoft 365
100% Clustered Stacked Bar Chart (Pro) renders conditional formatting and small multiples for Power BI reports.
PBIVizEdit.com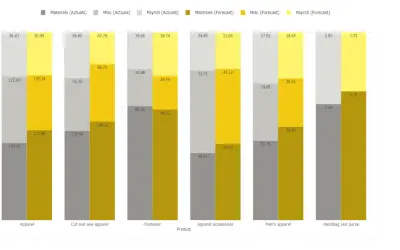
Compares multiple data series grouped by category with columns summing to 100% in Power BI Pro and Premium platforms.
PBIVizEdit.com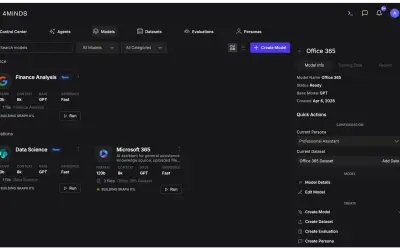
4MINDS deploys single-tenant custom language models in Azure using open-source models and a proprietary adapter.
4MindsAI Inc.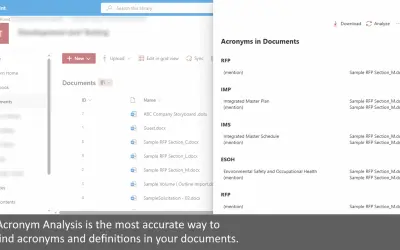
Searches all documents in a SharePoint document library for acronyms and definitions, with results viewable in the web or Excel.
XRSolutions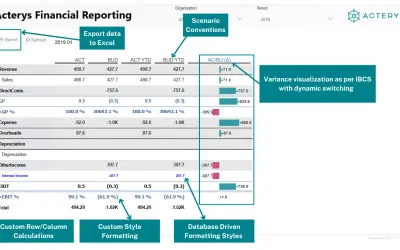
Builds IBCS-compliant financial reports in Power BI with custom calculations, automated formatting, and variance visuals.
Managility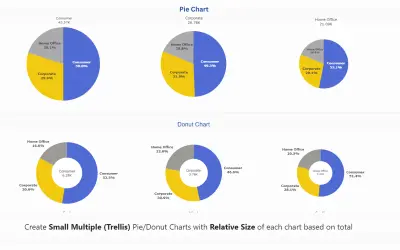
Advanced Donut and Pie Chart (Pro) provides trellis layouts, custom sorting, and conditional color formatting for Power BI.
PBIVizEdit.com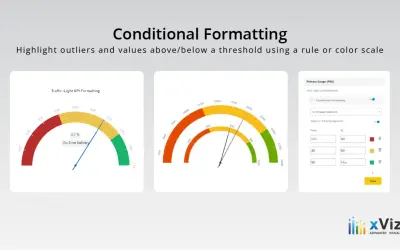
Advanced Gauge - xViz displays one or more data values against defined ranges using configurable gauge layouts for Power BI.
xViz LLC dba Lumel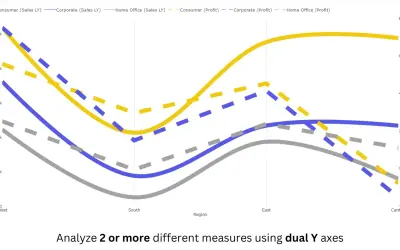
Power BI line chart visual with small multiples, reference and error bands, and categorical data on both X and Y axes.
PBIVizEdit.com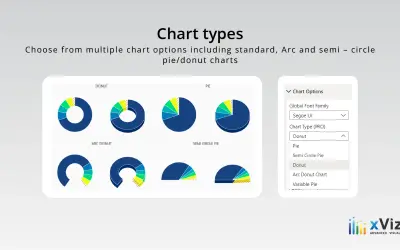
An xViz pie and donut chart for Power BI that compares parameters and displays each part's proportion of the whole.
xViz LLC dba Lumel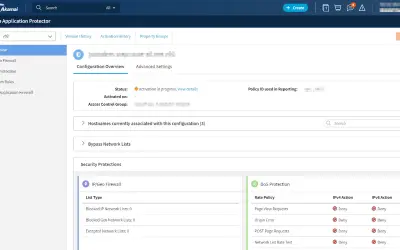
Akamai Web Application Protector provides automated WAF and DDoS protections with curated rules for securing web applications.
Akamai Technologies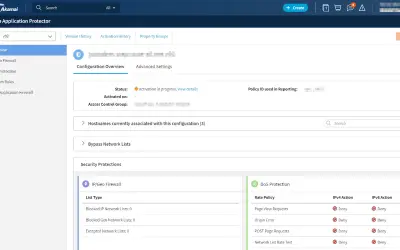
Web Application Protector offers automated WAF and DDoS protections that simplify the task of securing your web applications.
Akamai Technologies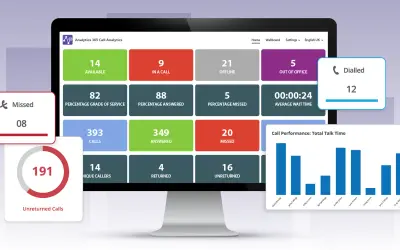
Provides call analytics for Microsoft Teams, giving companies insights into call activity, staffing levels, and performance.
Tollring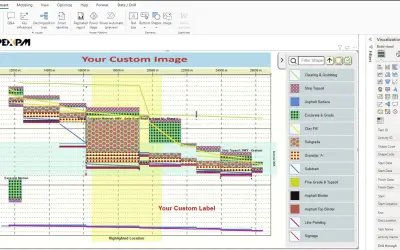
Apex Linear Schedule converts complex project schedules into Time-Location format charts within Microsoft Power BI.
APEX Project Management Inc.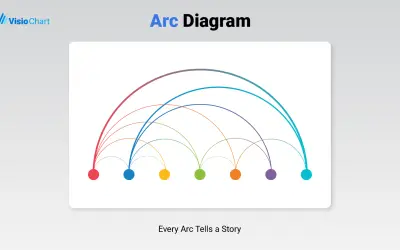
Places nodes on a single axis and connects related pairs with arcs whose size can reflect a numeric measure of strength.
VisioChart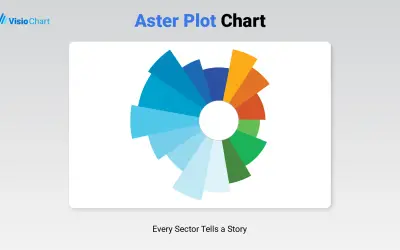
Visualizes categorical data in Power BI using two measures at once, with one shown by angle and the other by radius.
VisioChart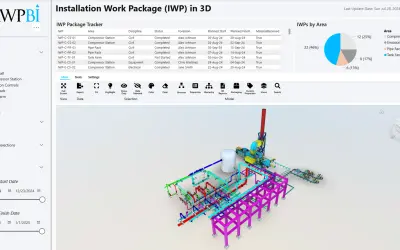
Power BI visual that turns a custom 3D model into a digital twin for asset monitoring, project tracking, and spatial analysis.
AWPBI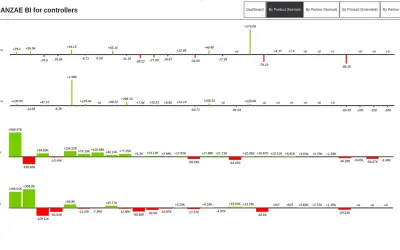
Banzae BI Dashboard provides a customizable visual interface for creating dynamic charts and graphs within Power BI.
Banzae Dooel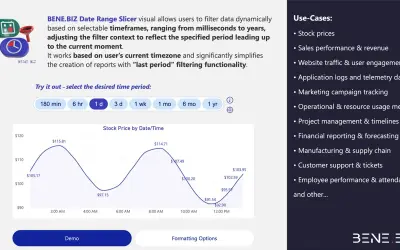
BENE.BIZ Date Range Slicer filters Power BI data dynamically by relative timeframes from milliseconds to years.
Alexander Rezun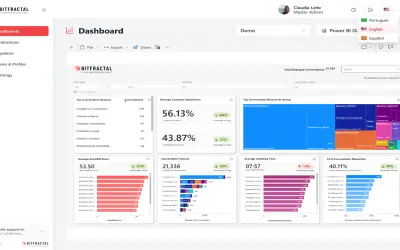
BitFractal Speech Analytics and AutoQM automates transcription, analysis, and scoring for contact center quality management.
BitFractal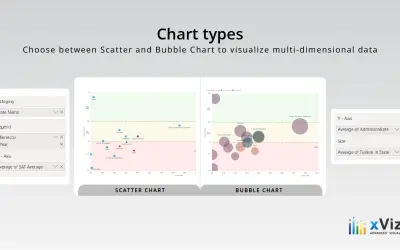
Bubble/Scatter Chart - xViz plots correlations between variables with trend lines and conditional formatting for Power BI.
xViz LLC dba Lumel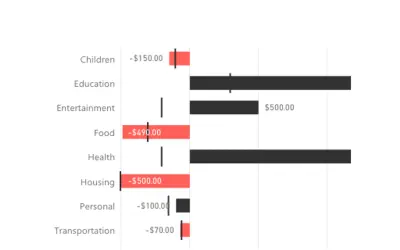
Bullet Chart by OKVIZ displays actual values, targets, and performance thresholds together in one space-saving Power BI chart.
OKVIZ Corp.
Power BI visual for comparing actuals against targets, with IBCS-certified bullet chart templates and comparison bands.
xViz LLC dba Lumel