1С Бухгалтерия + Power BI
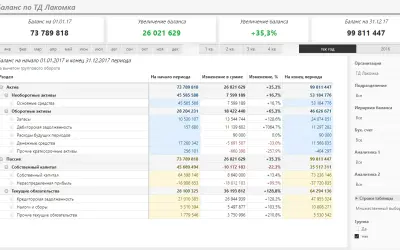
Connects 1C Accounting data to Power BI, providing pre-built financial reports and dashboards for business users.
ADD ReportPaidCompare
1350 analytics apps for Microsoft 365
Connects 1C Accounting data to Power BI, providing pre-built financial reports and dashboards for business users.
ADD Report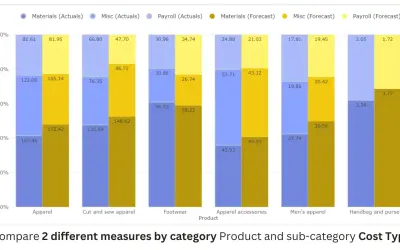
A 100% clustered stacked column chart visual with small multiples, reference lines, and pattern formatting for Power BI.
PBIVizEdit.com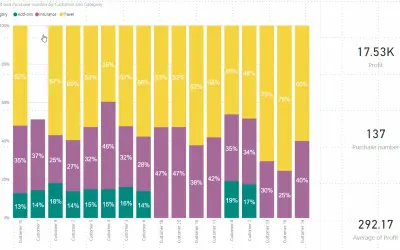
Plots 100% stacked column charts with rectangle selection and small multiple layouts for Power BI using category and value data.
Akvelon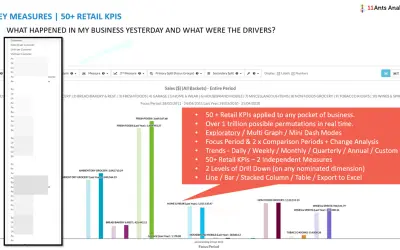
11Ants provides an analytics solution for retail stores to access insights, act on data, and measure decision impact.
11Ants Analytics Group Limited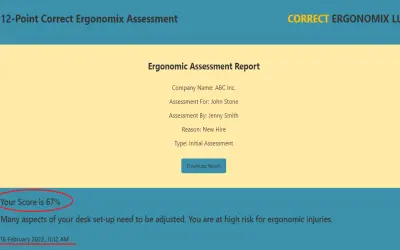
12-Point Correct Ergonomix trains and assesses employee workspace setups via interactive image-based e-learning modules.
Correct Ergonomix LLC
1st Reporting records and analyzes workplace incidents in real time across mobile and web platforms for incident tracking.
emAPPetizer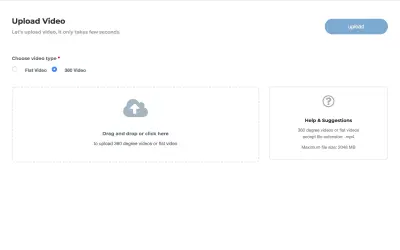
Creates immersive training experiences from standard and 360 video with analytics, delivered as SaaS running on Azure.
Lakeba Group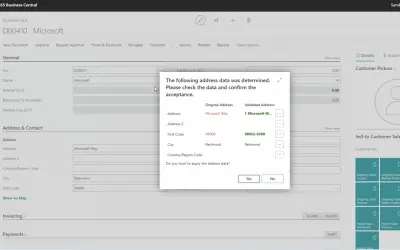
Validates, corrects, and completes global postal address data within Microsoft Dynamics 365 Business Central environments.
365 business development
Base connection interface for Microsoft Dynamics 365 Business Central that enables PDF, barcode, tax, and address services.
365 business development
A no-code app that applies stationery, merges files, and adds digital signatures to PDFs in Dynamics 365 Business Central.
365 business development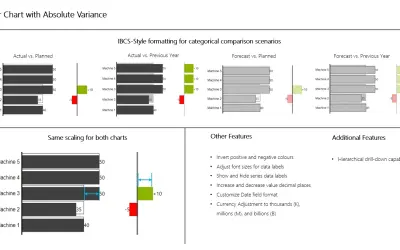
Calculates absolute variance between two scenarios and generates an overlapping bar chart for 3AG Systems visualization tools.
3AG Systems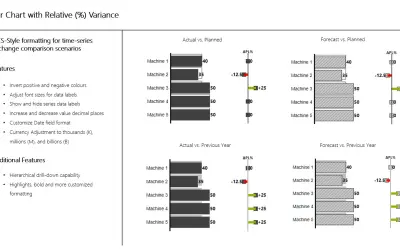
Calculates relative variance between two scenarios and generates an overlapping bar chart with a parallel lollipop chart.
3AG Systems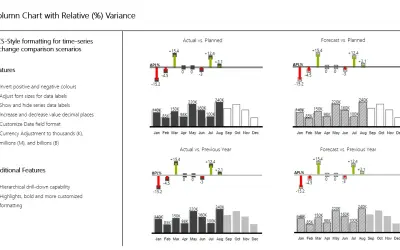
Calculates relative variance between two scenarios and generates an overlapping column chart with a parallel lollipop chart.
3AG Systems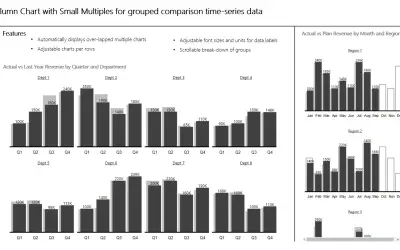
Compares Actual, Forecast, Planned, and Previous Year data across categories such as departments, regions, and products.
3AG Systems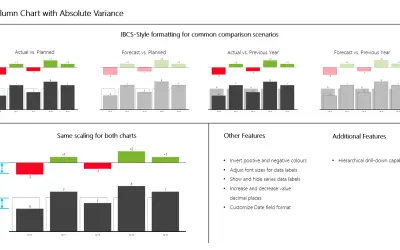
Column Chart with Variance compares two datasets, such as Actual vs. Planned or Forecast vs. Previous Year, in one visualization.
3AG Systems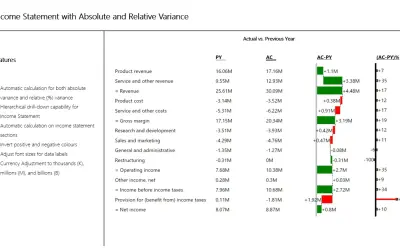
Calculates and plots absolute and relative income statement variances against previous year data for 3AG Systems.
3AG Systems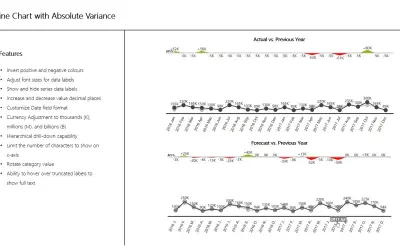
Displays two datasets as a line chart with the absolute variance shown per category, for comparisons such as Actual vs. Planned.
3AG Systems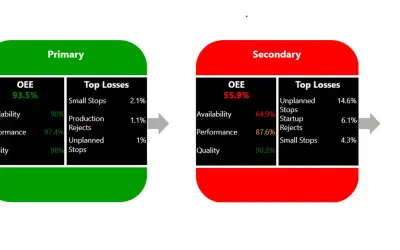
The 3AG Systems OEE Dashboard calculates Overall Equipment Effectiveness from actual production for a given time period.
3AG Systems
A 3D body scan subscription for health and fitness providers to assess movement, balance, and posture via digital twin technology.
Qinematic AB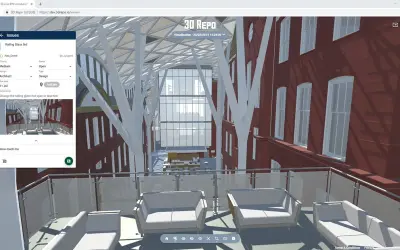
Connects 3D Repo BIM data to Microsoft Power BI to run reports and create custom dashboards for live analytics.
3D Repo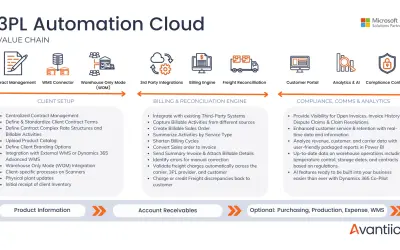
An add-on for Dynamics 365 Finance and Supply Chain Management that automates billing, reconciliation, and contract management.
Avantiico
Provides bite-sized, role-aligned training powered by AI to help users master Microsoft 365 and emerging AI tools.
4Sight Holdings