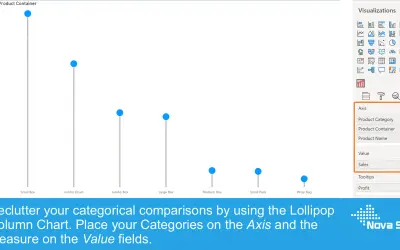
Lollipop Column Chart
Lollipop Column Chart displays a marker and line per category as an alternative to standard column charts in Power BI.
Nova SilvaFreemium
Displays hierarchical data in Power BI as bar or column charts with expandable parent and child elements.
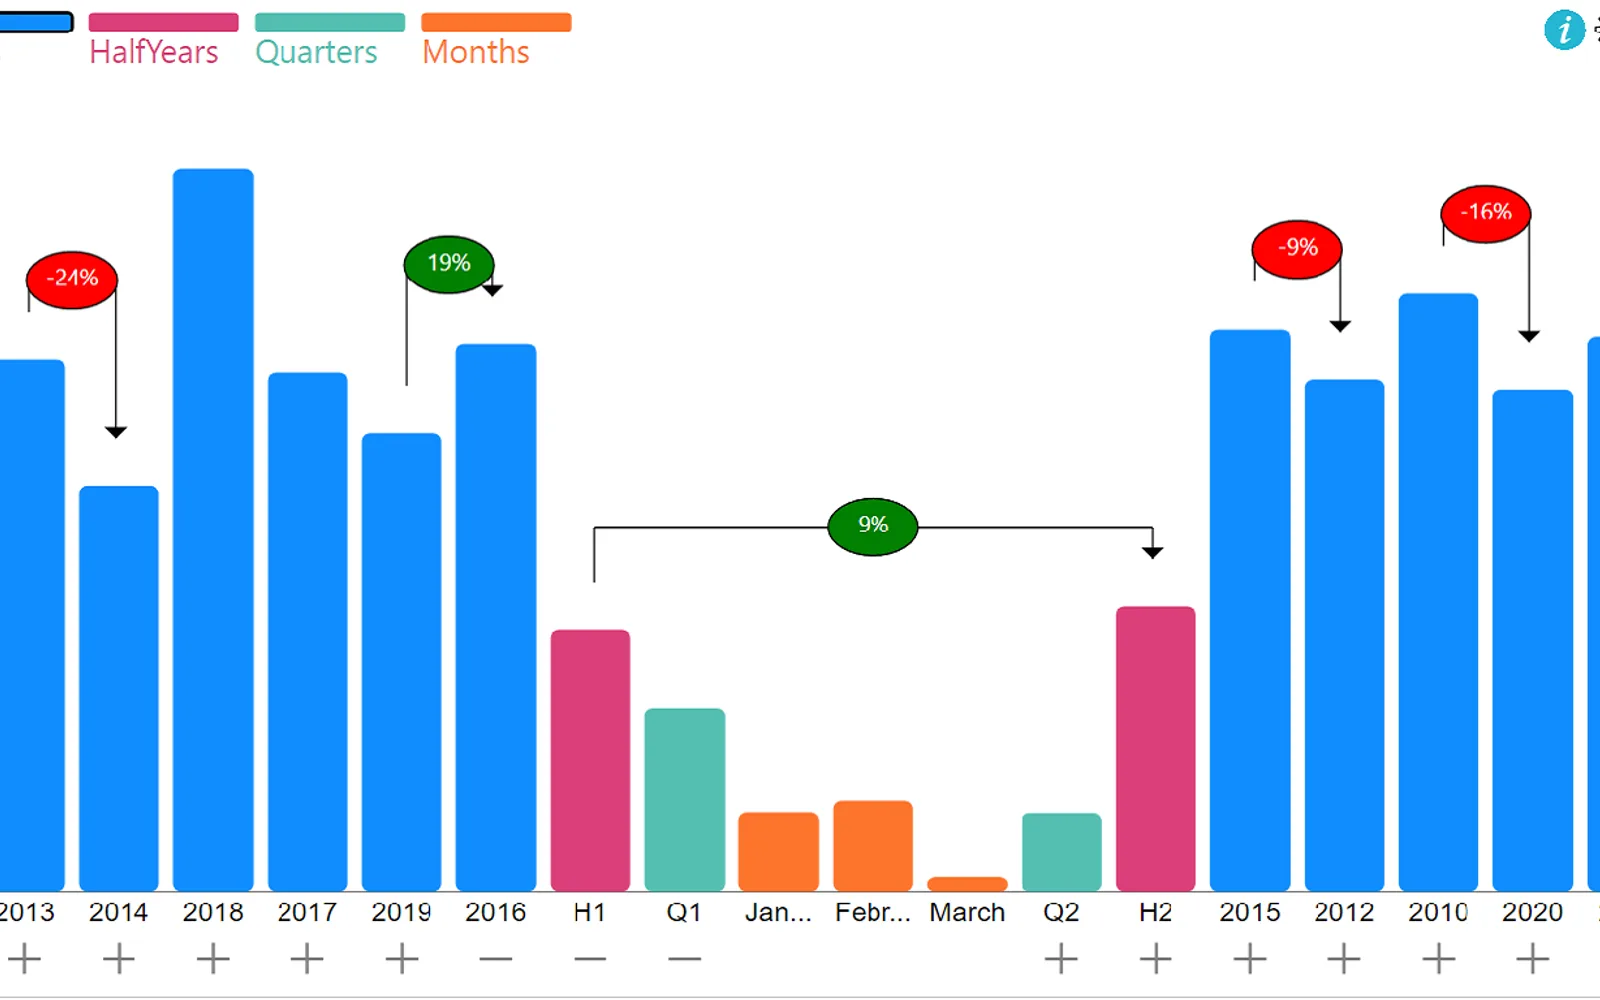
Displays hierarchical data with parent and child relationships as a bar or column chart in Power BI. Bars can be expanded or collapsed, reordered by dragging, and compared using variance and target views. Legends support drilling up or down through hierarchy levels. The visual is available without charge in Power BI Desktop and displays a watermark in Power BI Online unless a license subscription is purchased.
Plus and minus buttons show or hide child elements.
The visual can display variance between bars.
Bars can be dragged into a custom order.
Selecting legends drills up or down to hierarchy levels.
The visual can show targets.
657 plugins in Power BI · Analytics
Price distribution: 73 free, 108 freemium, 441 paid, 35 price not published
Lollipop Column Chart displays a marker and line per category as an alternative to standard column charts in Power BI.
Nova Silva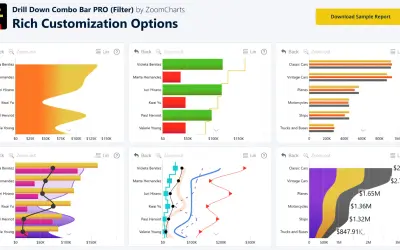
Sign up for a Free Developer License and get 1 year access to this and 20+ ZoomCharts visuals for use in Power BI Desktop!
ZoomCharts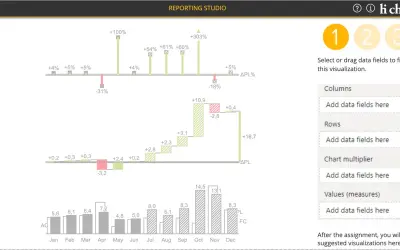
Creates charts, tables and waterfalls in Power BI with a built-in notation concept and automatic variance calculation.
CP Corporate Planning GmbH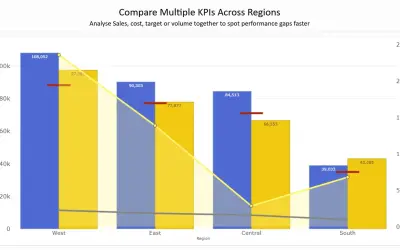
Combines column, line, area, and scatter charts on dual Y-axes to compare up to 8 metrics in a single Power BI visual.
PBIVizEdit.com«This visual was developed in partnership with Hamed Behairy - CFA. one of top financial trainers in the world Hierarchical bar chart is a Power BI Custom Visual which displays hierarchical data (different fields having parent/child relationship) in the form of a bar/column chart with +/- signs to view/hide details or …»