365 business Print Agent
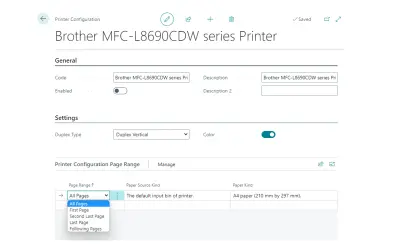
365 business Print Agent enables direct printing and ZPL commands from Microsoft Dynamics 365 Business Central reports.
365 business developmentFreeCompare
125 analytics apps for Microsoft 365
365 business Print Agent enables direct printing and ZPL commands from Microsoft Dynamics 365 Business Central reports.
365 business development
A Power BI visual that imports interactive 3D models in formats like OBJ, STL, and glTF with bidirectional cross-filtering.
Abdalla Dabes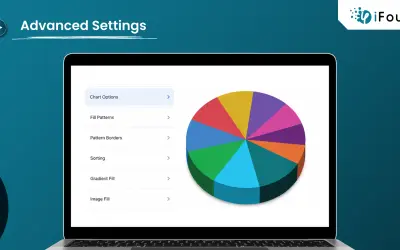
A custom visual for Microsoft Power BI that renders 3D pie and donut charts with adjustable depth, rotation, and filtering.
iFour Technolab Pvt. Ltd.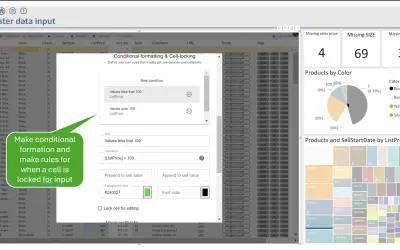
A Power BI visual for master data management that lets users edit and save data directly in Power BI with writeback to SQL.
Accobat A/S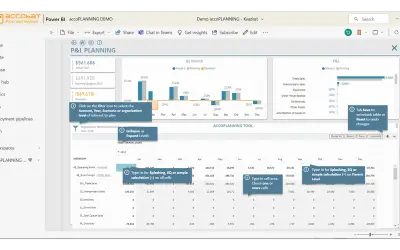
Planning and forecasting custom visual for Microsoft Power BI that writes employee input back to the data model.
Accobat A/S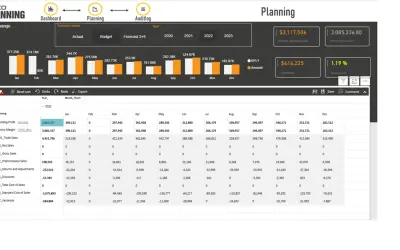
Writeback visual for Microsoft Power BI that saves budget and forecast input directly to your secure SQL database.
Accobat A/S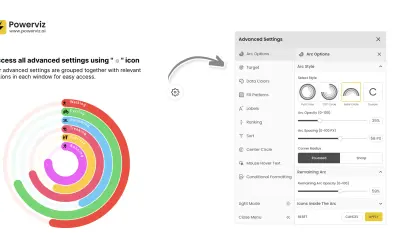
Power BI gauge visual by Powerviz that displays values or percentages by category to convey current status at a glance.
TRUVIZ INC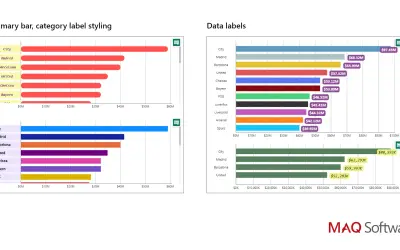
Linear gauge visual for Power BI that plots KPI values against a set target, with color-coded bars and tooltips.
MAQ LLC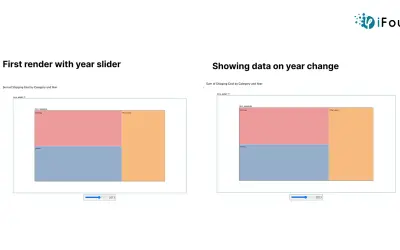
Animated Treemap by iFour tracks hierarchical data and explores time-based trends interactively within Power BI dashboards.
iFour Technolab Pvt. Ltd.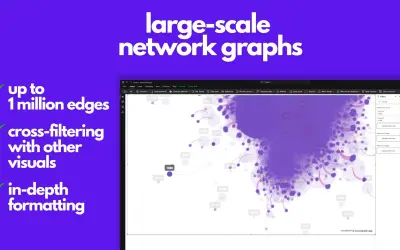
Astra renders large-scale network graphs with up to 1 million edges as a visual inside Power BI reports.
SecureMetrics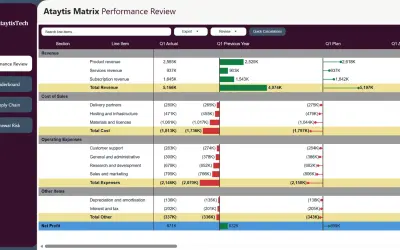
Ataytis Matrix provides configurable matrix and table-style reporting with advanced layout and formatting controls for Power BI.
AtaytisTech
Kanerika Inc.'s accelerator moves Azure Data Factory and Synapse pipelines into Microsoft Fabric Data Factory.
Kanerika Inc.
Centralized email signature management for organizations running Microsoft 365 alongside SMTP-based email clients.
BADEX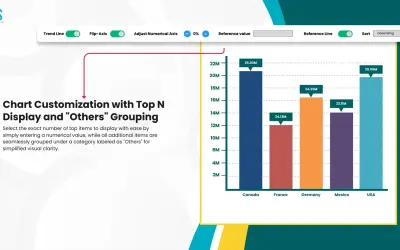
Custom bar chart from Innovational Office Solution that displays a chosen number of top items and groups the rest as Others.
Office Solution AI Labs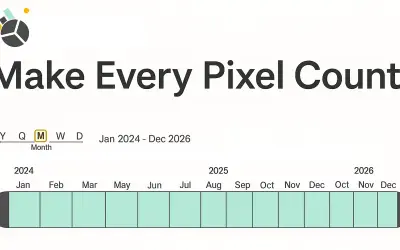
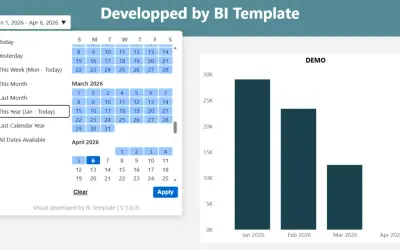
Your Timeline Slicer provides drag-and-drop date filtering by year, quarter, month, week, or day for Power BI reports.
Based On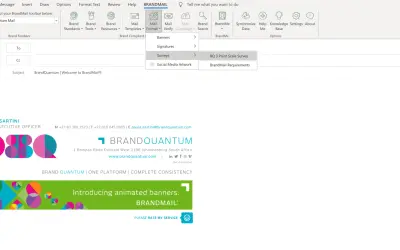
Centrally manages tamper-proof email signatures, banners, and content for Microsoft Outlook across devices and mail clients.
BrandQuantum
Bubble Diagram by VisioChart displays quantitative data as proportional bubble sizes for Microsoft Power BI reports.
VisioChart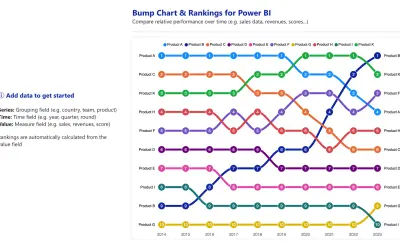
Bump Chart and Rankings tracks how metrics, entities, or categories change rank over time within Power BI reports.
ChartPad
Power BI custom visual that charts rank changes among products, teams, or individuals over time, with formatting controls.
iFour Technolab Pvt. Ltd.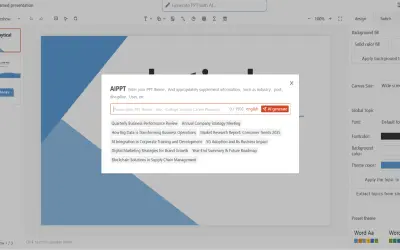
Bytical generates editable Microsoft PowerPoint decks from topics, outlines, or documents for sales teams and other presenters.
Bytical Solutions Private Limited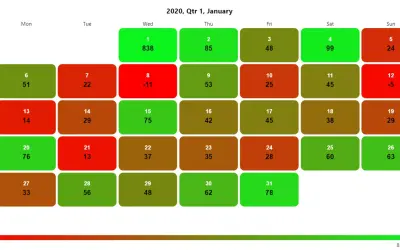
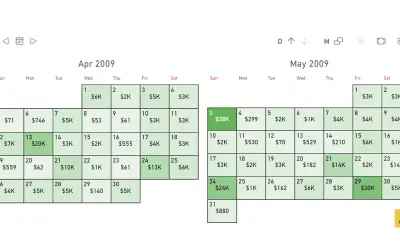
Calendar by Datanau displays and filters date-related data in year, quarter, month, and day views for Power BI visuals.
DATANAU - CONSULTORIA INFORMÁTICA, UNIPESSOAL, LDA