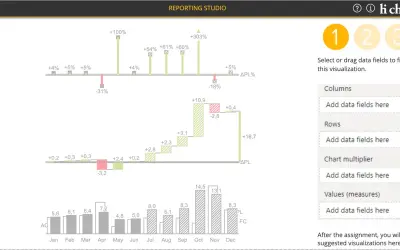
hi-chart Reporting Studio
Creates charts, tables and waterfalls in Power BI with a built-in notation concept and automatic variance calculation.
CP Corporate Planning GmbHFreemium
Add bubble charts, scatterplots, and portfolio analyses with two value axes in Power BI.
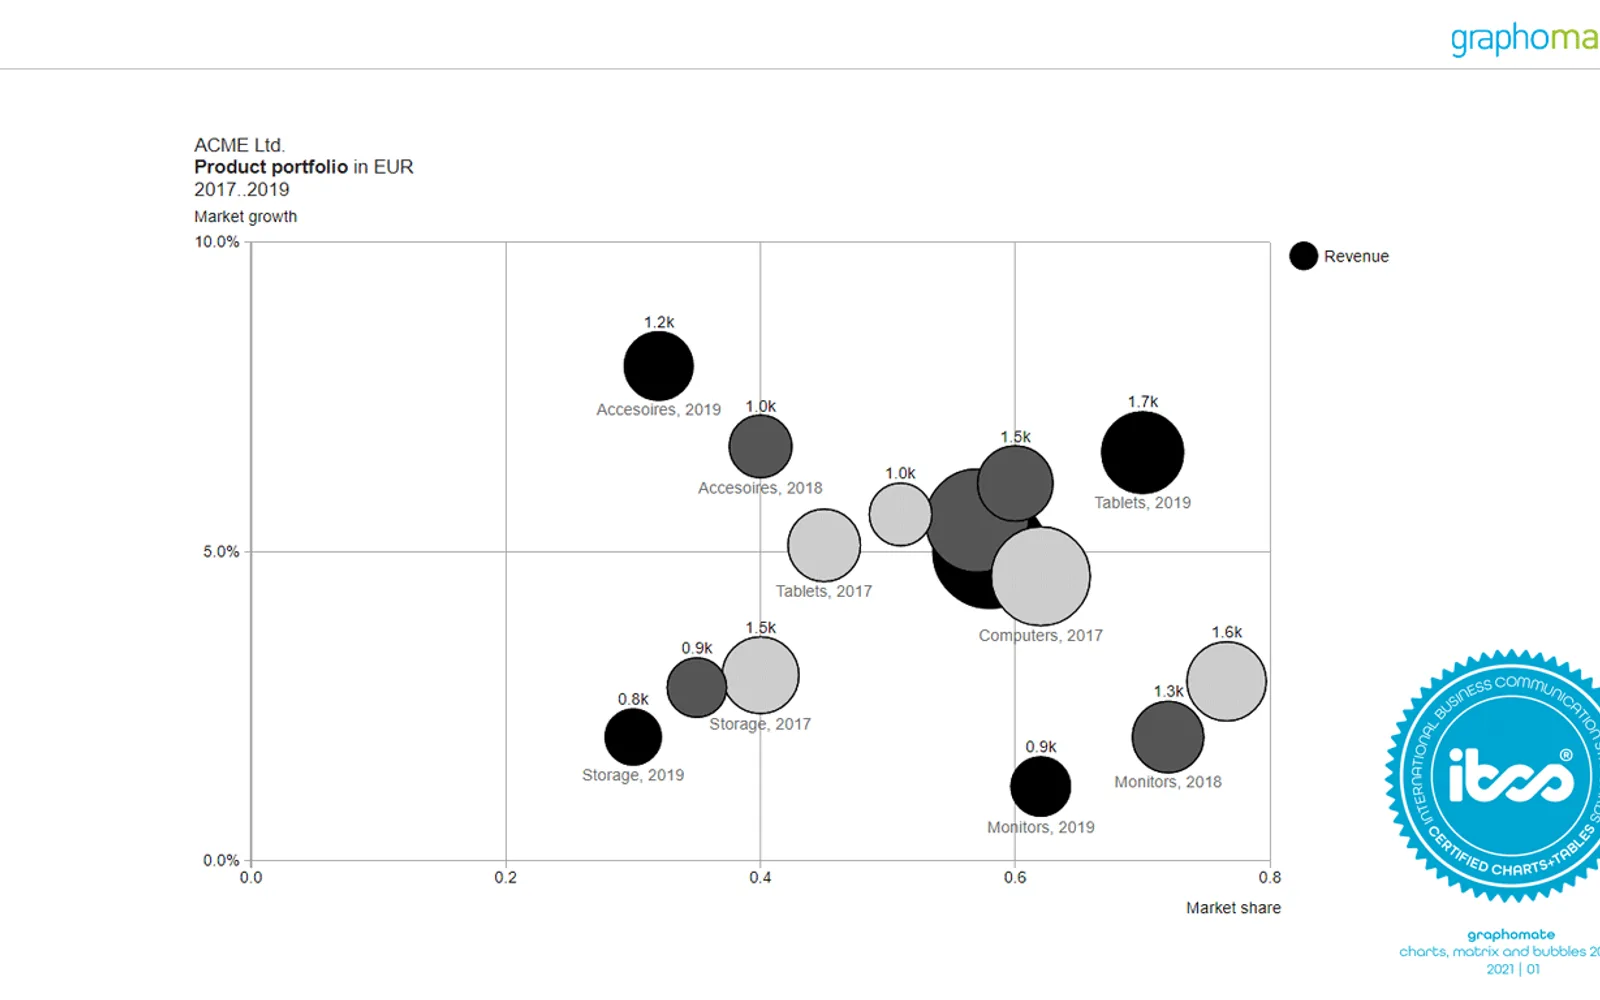
Adds bubble visualizations to Power BI with two value axes. It supports bubble charts, scatterplots, portfolio analyses based on the BCG matrix, small multiples, connected bubbles, conditional formatting, and different zoom modes. The add-in also supports different pie chart representations. In Power BI Desktop, all features are available without restrictions; Power BI Online adds a watermark unless a subscription license or time-limited demo version is used.
Uses two value axes for bubble charts, scatterplots, and multidimensional portfolio analyses.
Maps portfolio analyses according to the BCG matrix scheme.
Displays top items and the remainder according to available space.
Connects bubbles to represent developments over time.
Supports conditional formatting for the visualization.
Supports different zoom modes.
Provides settings for different pie chart representations.
The vendor states that the add-in is IBCS compliant.
graphomate bubbles uses free pricing, while hi-chart Reporting Studio and Innofalls Charts use freemium pricing and Hexbin Scatterplot by iFour uses paid pricing. All four listings use cloud deployment. graphomate bubbles was updated on Jul 2026, compared with Dec 2025 for hi-chart Reporting Studio and Innofalls Charts and Sep 2025 for Hexbin Scatterplot by iFour.
| Name | Pricing | Deployment | Updated |
|---|---|---|---|
| this plugin | Free | Cloud | |
| hi-chart Reporting Studio | Freemium | Cloud | |
| Innofalls Charts | Freemium | Cloud | |
| Hexbin Scatterplot by iFour | Paid | Cloud |
657 plugins in Power BI · Analytics
Price distribution: 73 free, 108 freemium, 441 paid, 35 price not published
Creates charts, tables and waterfalls in Power BI with a built-in notation concept and automatic variance calculation.
CP Corporate Planning GmbH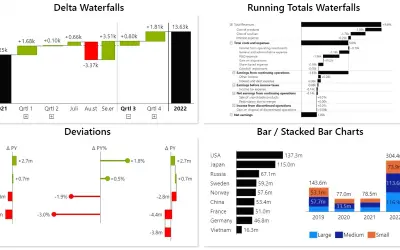
Power BI visual for building waterfall and bar charts through interactive navigation, drill downs, and dynamic comparisons.
Innofalls GmbH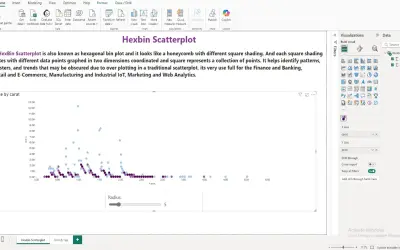
A Power BI visual that divides the data space into hexagonal bins to reduce overlap and visual clutter in large datasets.
iFour Technolab Pvt. Ltd.
Gantt Chart is a project management visual for Microsoft Power BI that tracks schedules, milestones, and resource workloads.
ChartPad«two value axes • mapping of portfolio analyses according to the scheme of the BCG matrix • Small multiples display (top n + rest, display according to space availability) • connection of bubbles to represent developments over time • application of conditional formatting • support of different zoom modes for increased …»