n8n
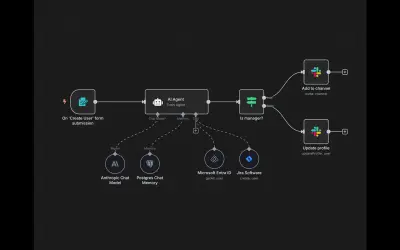
n8n is a workflow automation and AI app platform that connects APIs and internal tools for business processes.
n8n GmbHPaid
Visualizes data density on maps in Power BI using locally aggregated points and color mapping.
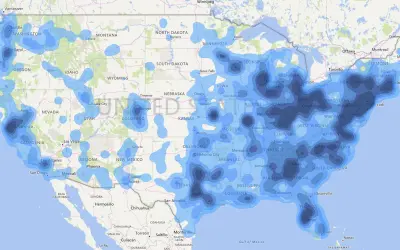
Heatmap visualizes the distribution of data points on a map. It aggregates nearby points and represents the resulting density with gradient or quantile colors.
Displays the distribution and density of data points on a map.
Aggregates data points locally for visualization.
Maps aggregated values to gradient or quantile colors.
51 plugins in GitHub · Analytics
Price distribution: 1 free, 2 freemium, 42 paid, 6 price not published
n8n is a workflow automation and AI app platform that connects APIs and internal tools for business processes.
n8n GmbH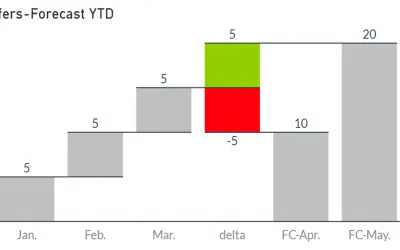
Waterfall-Visual-Extended renders waterfall and bridge charts with delta elements, custom bars, and configurable labels and axes.
Auxil Management GmbH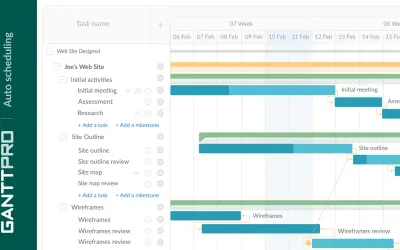
Task, resource, cost, and deadline management with team collaboration in GanttPRO, an online project management solution.
XB Software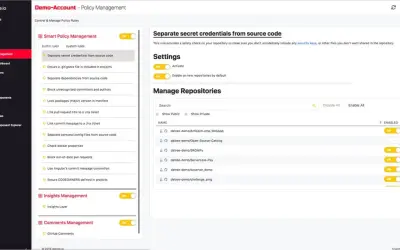
Datree Smart Policy provides automatic policy compliance checks and insights for every GitHub code commit across an organization.
Datree«Heat maps are a type of visualization to show data density on a map. They are particularly helpful when you have a lot of (e.g., tens of thousands of) data points on the map and are mainly interested in their overall distribution. Technically, in a heatmap, data points are aggregated locally and mapped to colors …»