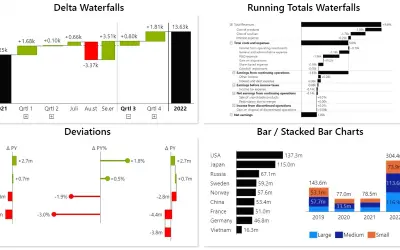
Innofalls Charts
Power BI visual for building waterfall and bar charts through interactive navigation, drill downs, and dynamic comparisons.
Innofalls GmbHFreemium
Build standardized bar, column, needle, stacked bar, and waterfall visuals in Microsoft Power BI.
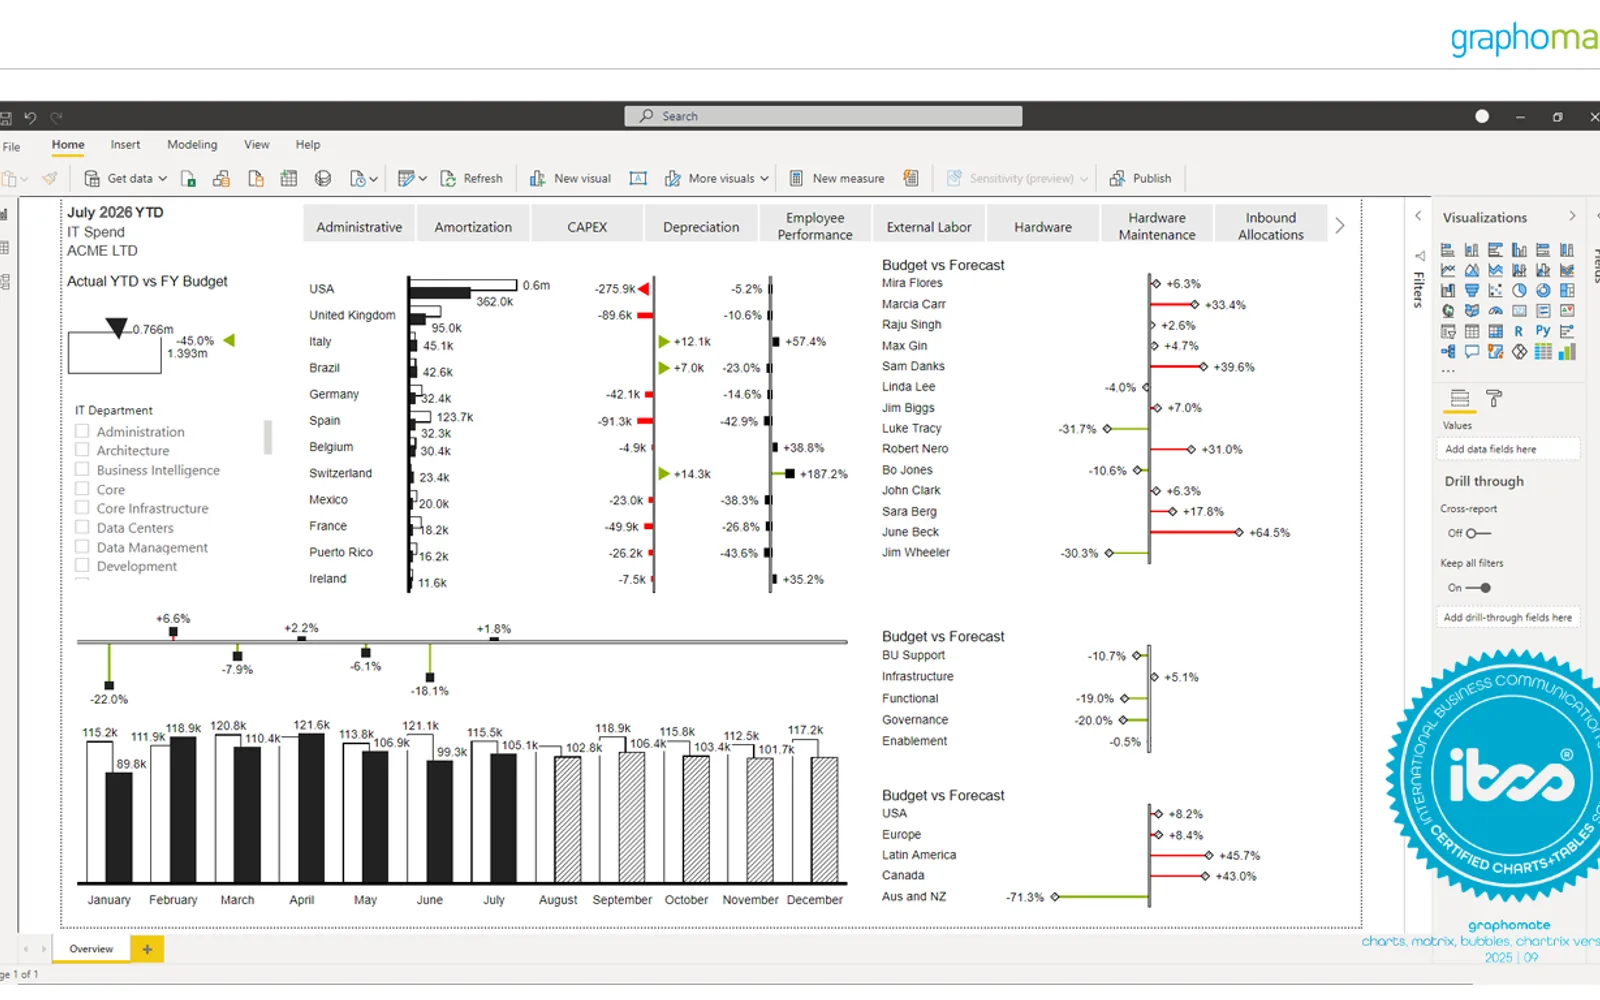
Adds six chart formats for presenting data with a standardized notation in Microsoft Power BI. The visual supports drilldowns, highlighting, selections, and tooltips within Power BI. It includes deviation charts without DAX scripting, mixed-format visuals, comparison groups, small multiples, and shared templates. All features are available in Power BI Desktop at no cost; the Power BI Online Service requires a subscription to remove the watermark.
Provides bar, column, needle, stacked bar, and waterfall visual formats.
Supports drilldowns, highlighting, selections, and tooltips in Power BI.
Offers deviation charts without requiring DAX scripting.
Allows multiple chart formats within one visualization.
Applies uniform scaling across different chart visuals in a report.
Creates repeated chart views for examining trends across categories.
Enables templates to be shared across platforms for company dashboards.
graphomate charts has a free price type, while Innofalls Charts, hi-chart Reporting Studio, and Dual Y-Axis Combo Chart (Standard) have freemium price types. Ultimate KPI Card has a paid price type. graphomate charts and all four alternatives use cloud deployment. graphomate charts was updated on Jul 2026; Innofalls Charts, hi-chart Reporting Studio, and Dual Y-Axis Combo Chart (Standard) were updated on Dec 2025, while Ultimate KPI Card was updated on Feb 2026.
| Name | Pricing | Deployment | Updated |
|---|---|---|---|
| this plugin | Free | Cloud | |
| Innofalls Charts | Freemium | Cloud | |
| hi-chart Reporting Studio | Freemium | Cloud | |
| Dual Y-Axis Combo Chart (Standard) | Freemium | Cloud | |
| Ultimate KPI Card | Paid | Cloud |
657 plugins in Power BI · Analytics
Price distribution: 73 free, 108 freemium, 441 paid, 35 price not published
Power BI visual for building waterfall and bar charts through interactive navigation, drill downs, and dynamic comparisons.
Innofalls GmbH
Creates charts, tables and waterfalls in Power BI with a built-in notation concept and automatic variance calculation.
CP Corporate Planning GmbH
Power BI custom visual that displays a measure with variance to a target and/or previous year in absolute and percentage terms.
dataviz.boutique GmbH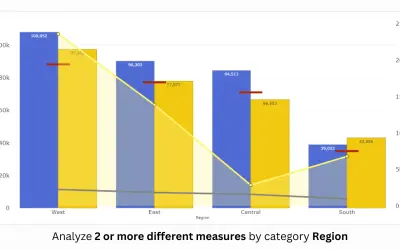
PBIVizEdit custom visual for Power BI that builds dual y-axis charts combining line, area, scatter, and column series.
PBIVizEdit.com«The graphomate charts are our IBCS®-certified charting component, which offer the six basic chart types necessary to realize a standardized notation within Microsoft Power BI. In addition to bar and column charts, you can use needle and stacked bar charts, as well as waterfall charts—for example, for P&L or …»