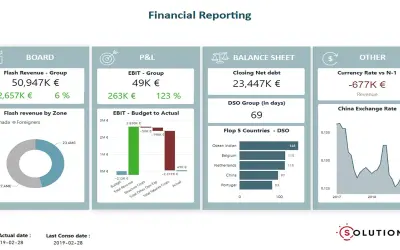
Financial Reporting Dashboard
Financial dashboard that delivers real-time data and indicators to finance teams and C-Levels, compatible with Microsoft Office.
SOLUTION BIPaid
Harvest data app for Power BI that reports logged hours, project details, and team performance metrics.
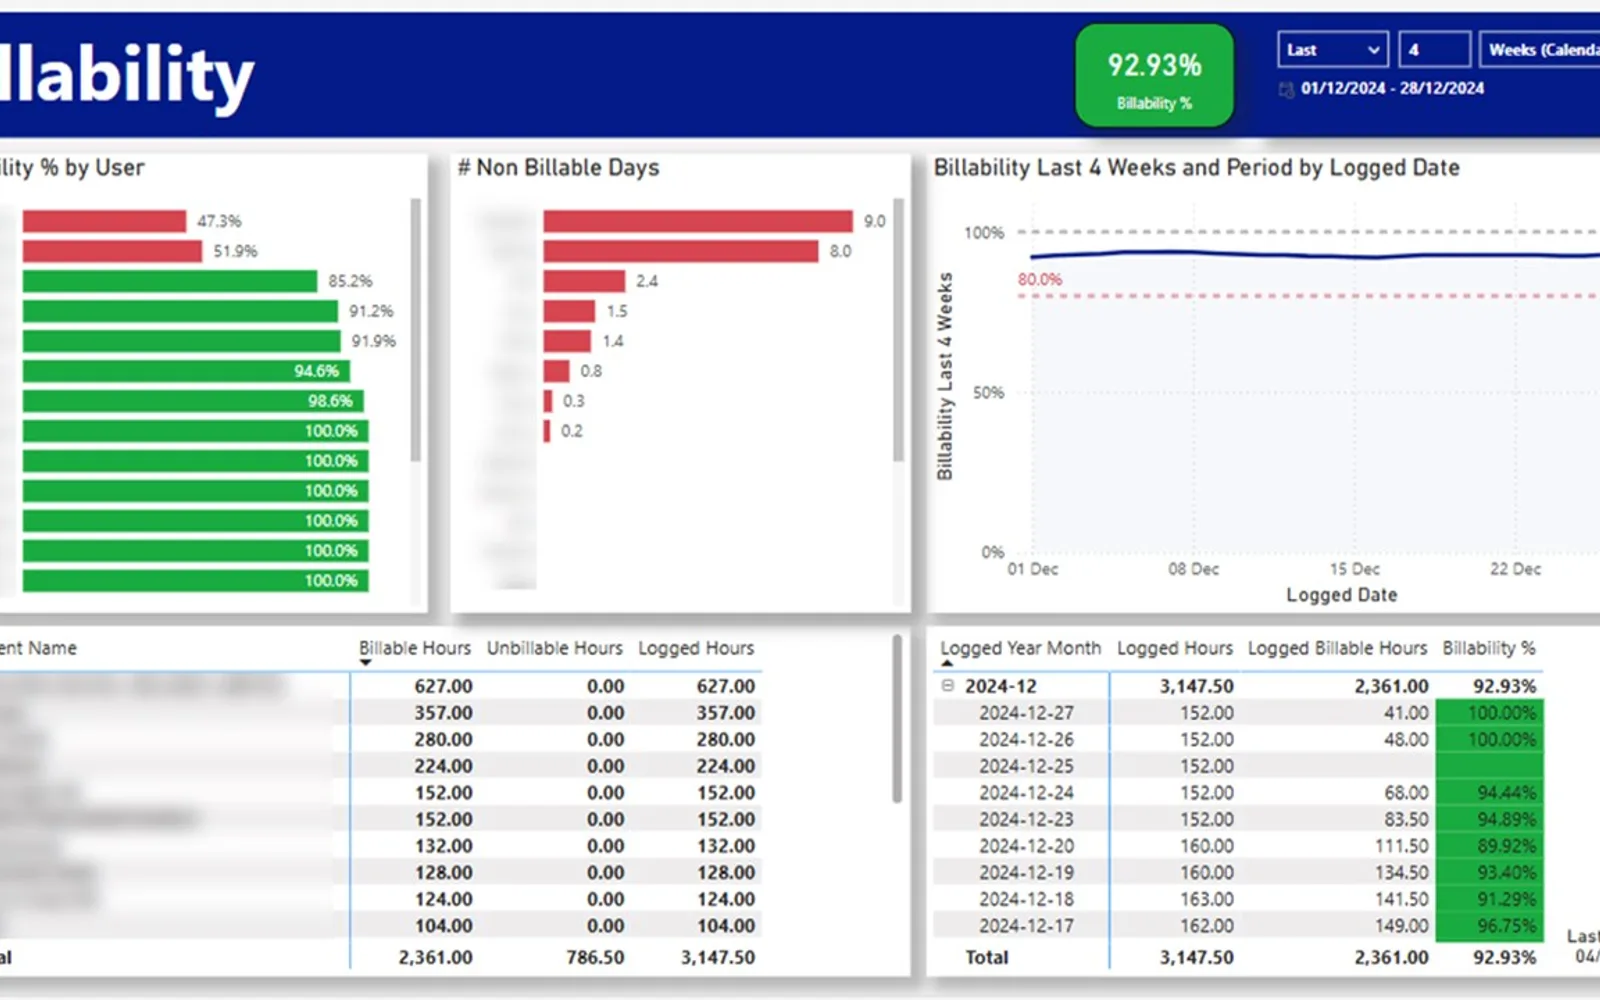
The app extracts logged hours, project details, and team performance metrics from Harvest. It feeds this data into Power BI for customizable reports on time utilization, decision-making, and project management.
Extracts logged hours, project details, and team performance metrics from Harvest.
Feeds extracted Harvest data into Power BI.
Supports the creation of customizable reports from Harvest data.
Harvest Reporting is a paid, cloud-deployed listing updated on Jan 2025. Financial Reporting Dashboard and Finance Connector for Power BI are also paid and cloud-deployed, with update dates of Dec 2025 and Jun 2026. Autodesk® Data Connector for Power BI - Viewer, NAVBI Sales, and HR Reporting and Analytics- Power BI Dashboard also use paid cloud deployment, with update dates of Jul 2026, Feb 2026, and Jul 2026.
| Name | Pricing | Deployment | Updated |
|---|---|---|---|
| this plugin | Paid | Cloud | |
| Financial Reporting Dashboard | Paid | Cloud | |
| Finance Connector for Power BI | Paid | Cloud | |
| Autodesk® Data Connector for Power BI - Viewer | Paid | Cloud | |
| NAVBI Sales | Paid | Cloud | |
| HR Reporting and Analytics- Power BI Dashboard | Paid | Cloud |
657 plugins in Power BI · Analytics
Price distribution: 73 free, 108 freemium, 441 paid, 35 price not published
Financial dashboard that delivers real-time data and indicators to finance teams and C-Levels, compatible with Microsoft Office.
SOLUTION BI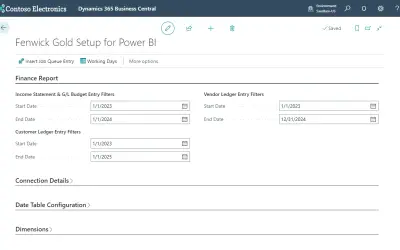
Provides the data connections and system functions required to export Business Central data in a reporting format for Power BI.
Fenwick
Fetches data from Data Exchanges and feeds them into Microsoft Power BI to construct comprehensive reports and dashboards.
Autodesk, Inc.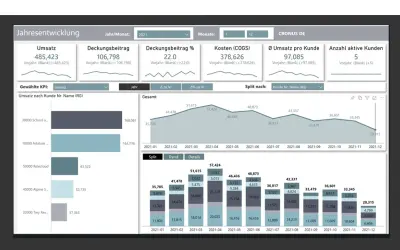
Displays Business Central metrics in dashboards with drilldown from aggregated figures to the transaction level.
navida«This Power BI app integrates two powerful tools—Harvest and Power BI. It extracts data from Harvest, such as logged hours, project details, and team performance metrics, and feeds this data into Power BI. This integration allows you to create dynamic, customizable reports that provide clear insights into how time is …»