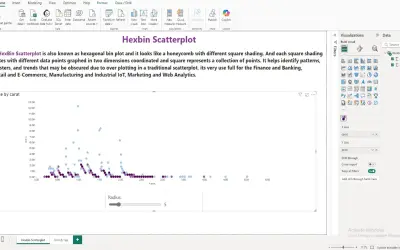
Hexbin Scatterplot by iFour
A Power BI visual that divides the data space into hexagonal bins to reduce overlap and visual clutter in large datasets.
iFour Technolab Pvt. Ltd.Paid
Color-coded grid visual for representing Power BI data in a tabular heatmap.
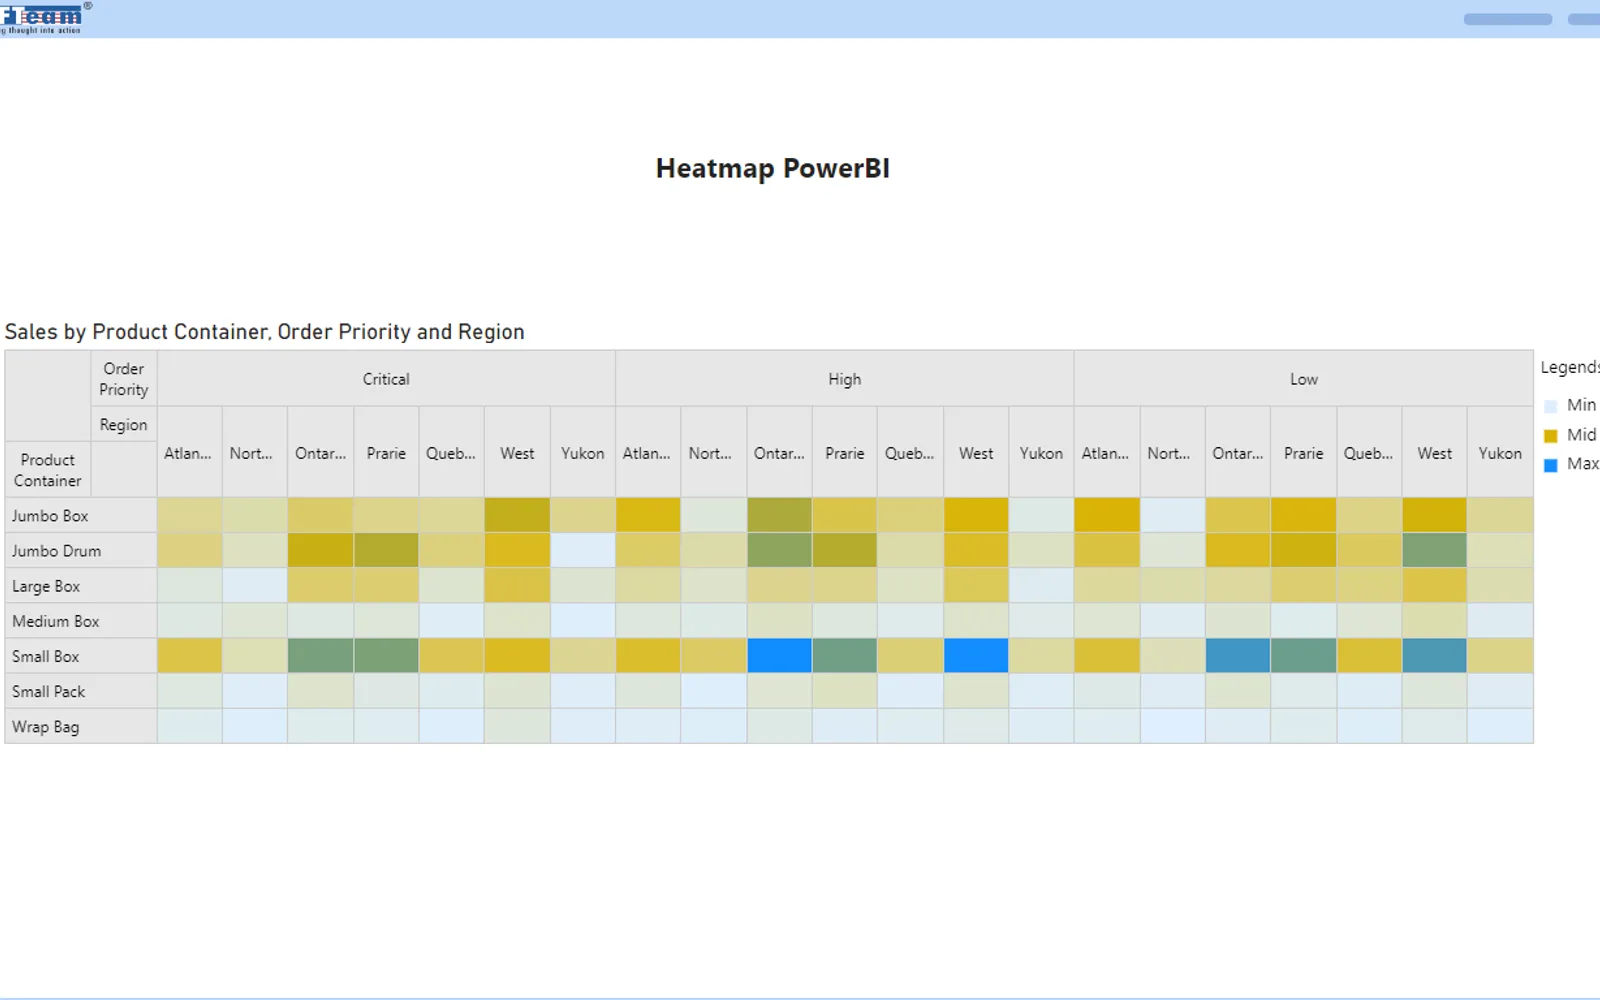
Displays Power BI data in a grid where each cell uses a color gradient based on its underlying value. The visual presents data in a tabular format and supports interactive exploration of patterns, trends, correlations, anomalies, and comparisons.
Represents data points in a grid-like structure.
Fills cells with color gradients based on underlying data values.
Presents Power BI data in a tabular format with colors.
Supports interactive exploration of the displayed data.
Heatmap Visual uses a freemium pricing model, while Hexbin Scatterplot by iFour and Aimplan Planning and Reporting Visual are paid, and Waffle Chart Maker and Risk & Opportunity Matrix are free. All listed alternatives use cloud deployment, as does Heatmap Visual. Heatmap Visual was updated on Dec 2025; the alternatives were updated in Sep 2025, Dec 2025, May 2026, and May 2025 respectively.
| Name | Pricing | Deployment | Updated |
|---|---|---|---|
| this plugin | Freemium | Cloud | |
| Hexbin Scatterplot by iFour | Paid | Cloud | |
| Aimplan Planning and Reporting Visual | Paid | Cloud | |
| Waffle Chart Maker | Free | Cloud | |
| Risk & Opportunity Matrix | Free | Cloud |
657 plugins in Power BI · Analytics
Price distribution: 73 free, 108 freemium, 441 paid, 35 price not published
A Power BI visual that divides the data space into hexagonal bins to reduce overlap and visual clutter in large datasets.
iFour Technolab Pvt. Ltd.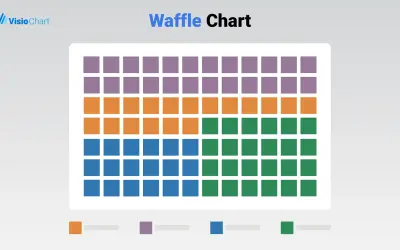
Waffle Chart Maker renders grid-based charts from numbers or percentages with sorting and cross-filtering for Microsoft Power BI.
VisioChart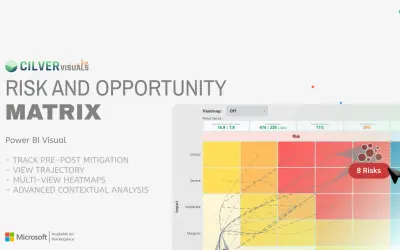
Power BI custom visual that shows downside risks and upside opportunities in one interface with pre- and post-mitigation states.
Cilver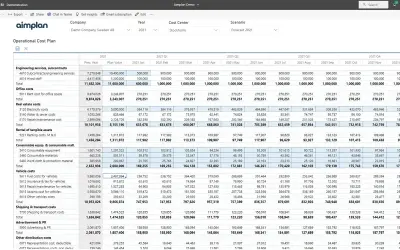
Planning and reporting visual for Power BI that supports budgeting, forecasting, and financial reporting in one tool.
Aimplan AB«A heatmap is a powerful visualization tool commonly used in Power BI to represent data in a tabular format with colors. It provides a visual representation of data points through a grid-like structure, where each cell is filled with a color gradient based on the underlying data values. Heatmaps are particularly …»