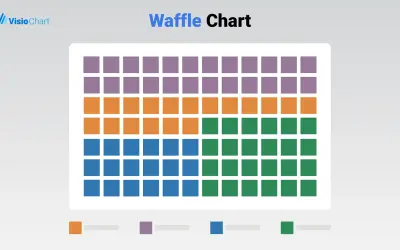
Waffle Chart Maker
Waffle Chart Maker renders grid-based charts from numbers or percentages with sorting and cross-filtering for Microsoft Power BI.
VisioChartFree
Create bubble charts in Power BI that show three quantitative variables through position and bubble size.
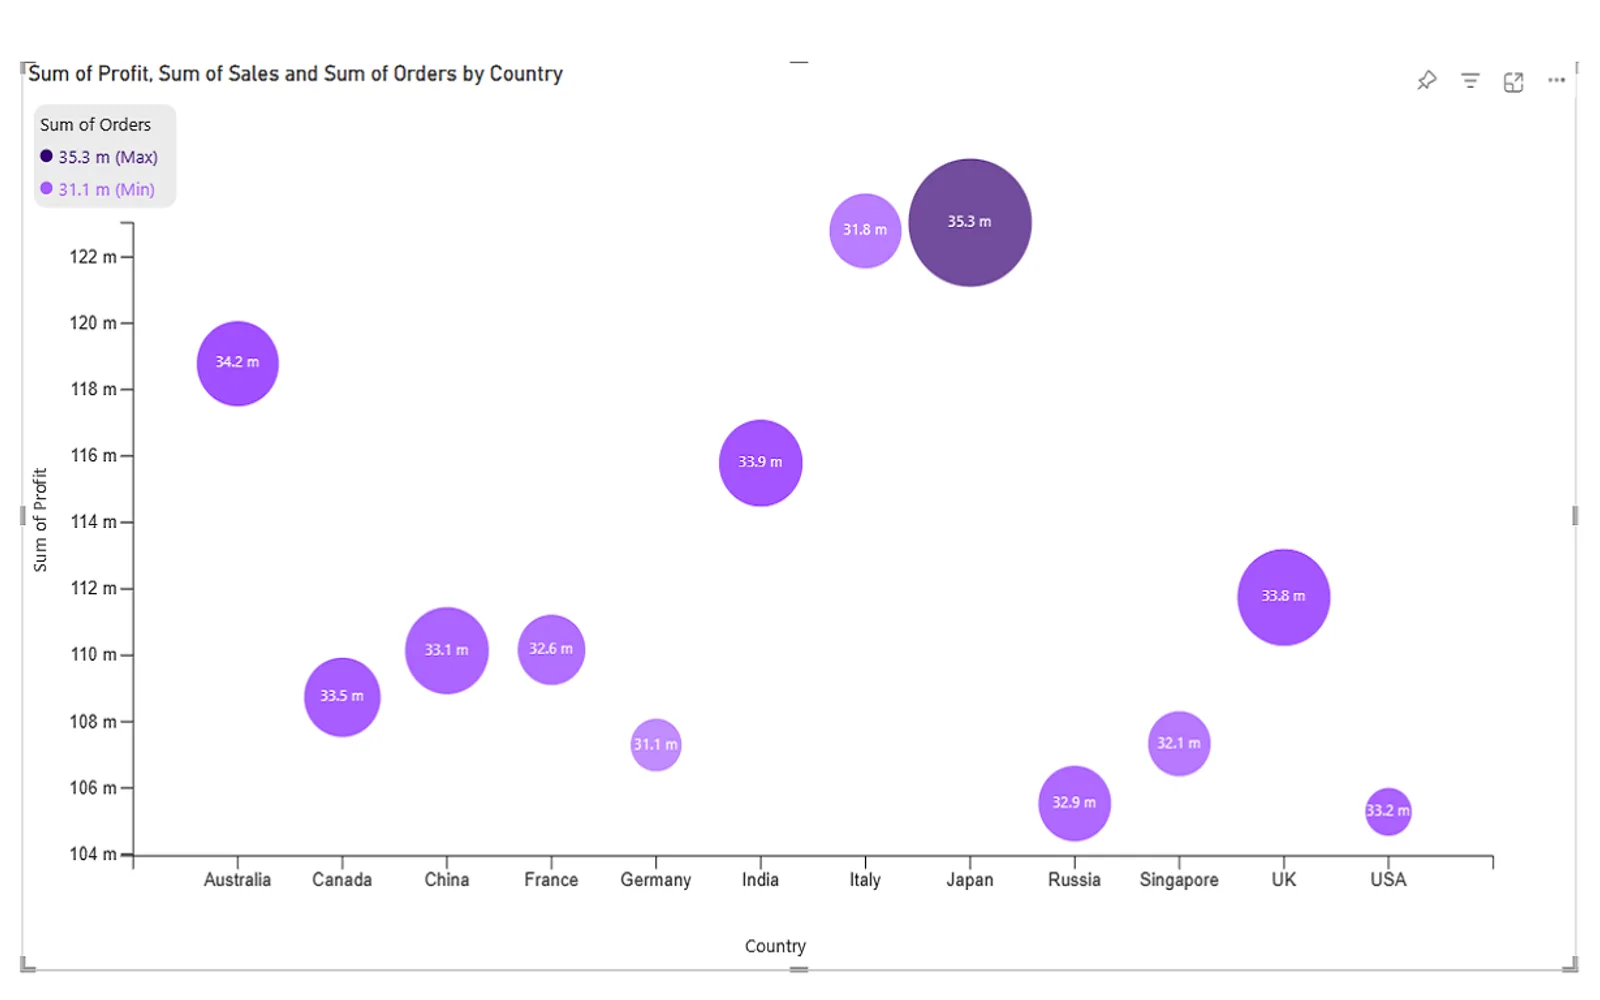
Creates bubble charts in Power BI from x-, y-, and z-values. The x- and y-axes represent two dimensions, while bubble size represents a third variable. Bubble color, transparency, and labels can be customized. Tooltips and cross-filtering support interaction with the data.
Displays three quantitative variables through x-axis position, y-axis position, and bubble size.
Adjusts bubble size, color, and transparency.
Adds labels to bubbles.
Supports tooltips and cross-filtering.
HCLTech 4-Dimensional Bubble Chart and Waffle Chart Maker are free and cloud-deployed, and both were updated in Dec 2025. Advanced Pie and Donut - xViz, Bubble Chart with Categorical Data (Pro), and Sunburst Chart are freemium and cloud-deployed, and were updated in Dec 2025. Hexbin Scatterplot by iFour is paid and cloud-deployed, and was updated in Sep 2025.
| Name | Pricing | Deployment | Updated |
|---|---|---|---|
| this plugin | Free | Cloud | |
| Waffle Chart Maker | Free | Cloud | |
| Advanced Pie and Donut - xViz | Freemium | Cloud | |
| Bubble Chart with Categorical Data (Pro) | Not in catalog | ||
| Sunburst Chart | Freemium | Cloud | |
| Hexbin Scatterplot by iFour | Paid | Cloud | |
657 plugins in Power BI · Analytics
Price distribution: 73 free, 108 freemium, 441 paid, 35 price not published
Waffle Chart Maker renders grid-based charts from numbers or percentages with sorting and cross-filtering for Microsoft Power BI.
VisioChart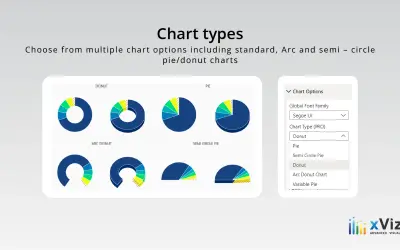
An xViz pie and donut chart for Power BI that compares parameters and displays each part's proportion of the whole.
xViz LLC dba Lumel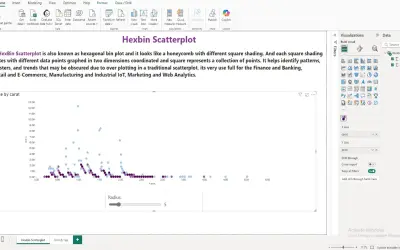
A Power BI visual that divides the data space into hexagonal bins to reduce overlap and visual clutter in large datasets.
iFour Technolab Pvt. Ltd.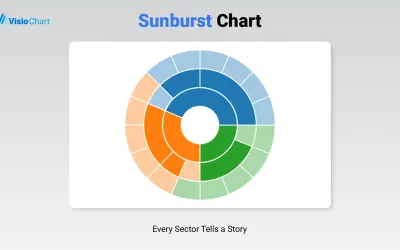
Displays up to five levels of hierarchical data as proportional segments across concentric rings in Power BI reports.
VisioChart«A bubble chart, also known as a bubble visual, is a type of multivariable graph that uses bubbles or circles to represent data points in three dimensions. It is a variation of scatter plots, but instead of using dots, it uses bubbles to display the values of three quantitative variables. To create a bubble chart in …»