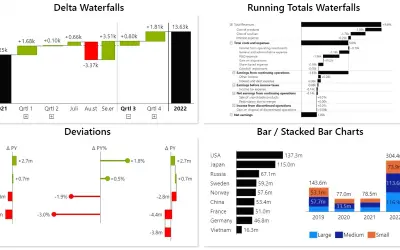
Innofalls Charts
Power BI visual for building waterfall and bar charts through interactive navigation, drill downs, and dynamic comparisons.
Innofalls GmbHFreemium
Adds configurable matrix tables, in-cell charts, hierarchies and calculations to Power BI reports.
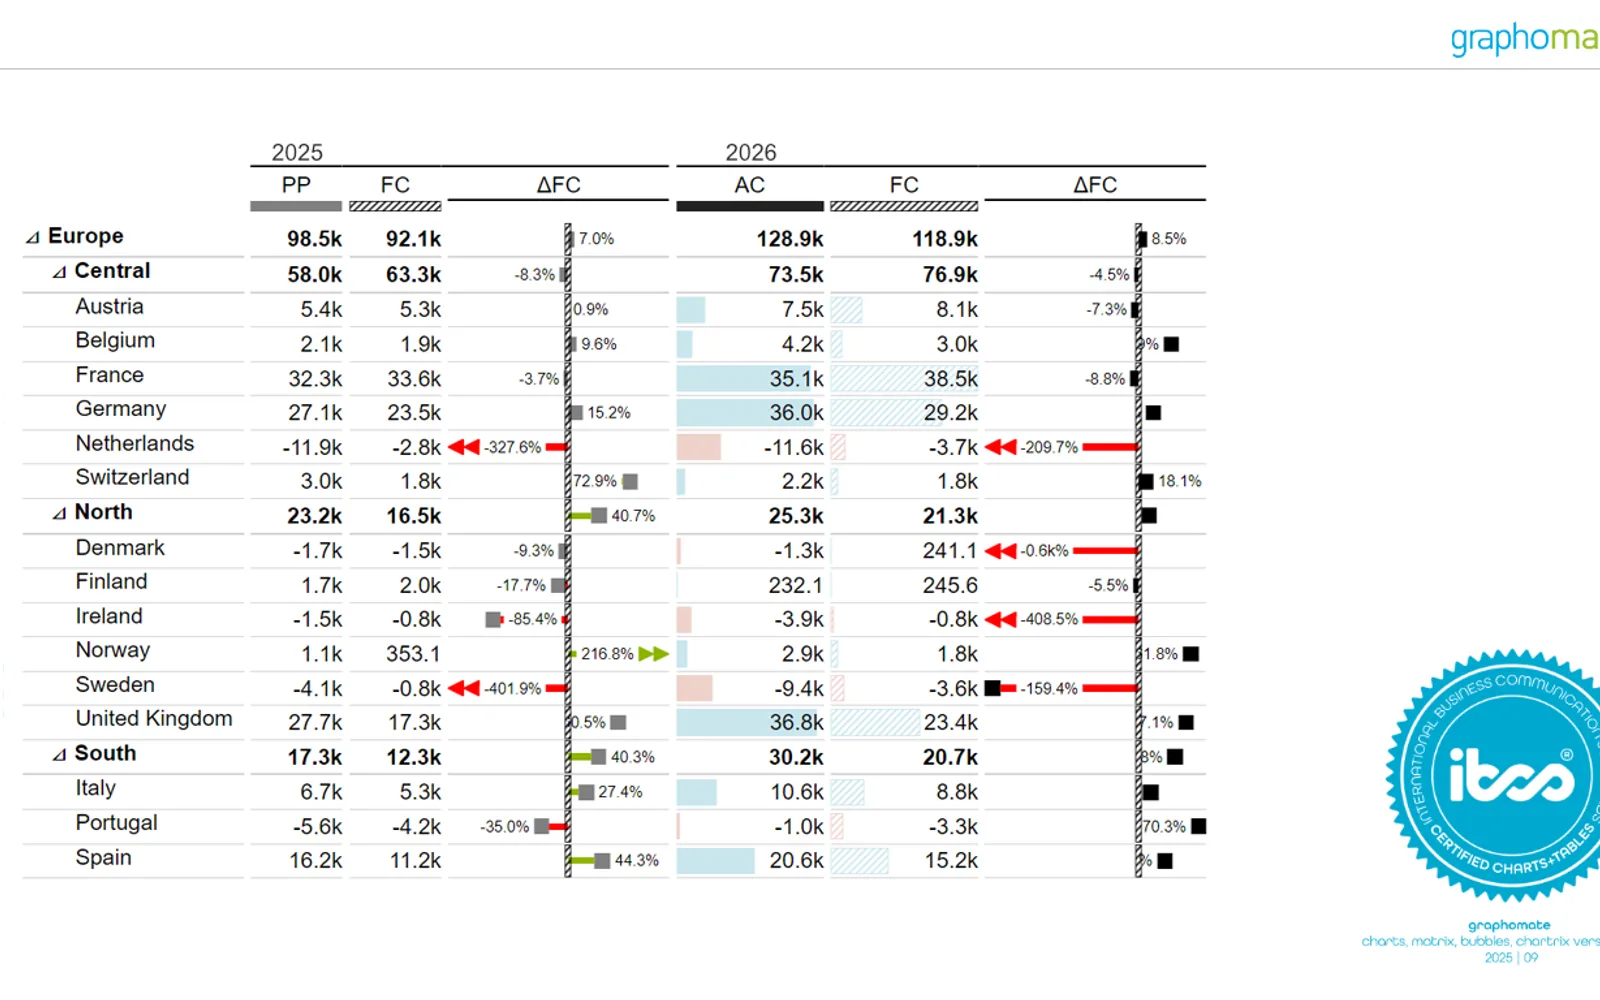
The graphomate matrix provides table views for Power BI, including hierarchical and CrossTab layouts. It supports in-cell charts such as variance bars, needle charts, sparklines and background bars. Columns, rows and cells can use conditional formatting, custom formulas, aggregations and variance calculations. Power BI Desktop includes all features without restrictions; Power BI Online adds a watermark unless a subscription license is used.
Displays deviations, sparklines, bar charts, needle charts and background bars within table cells.
Formats individual columns, rows or cells based on their values.
Displays large hierarchies in rows and columns using hierarchical or CrossTab views.
Adds variance calculations, aggregations, custom formulas and N + Rest calculations.
Uses the JavaScript-based Cell Formatting Language to control the matrix appearance.
Supports IBCS rules including deviations, column scenarios and background bar charts.
graphomate matrix is free, while Innofalls Charts, Flexa Tables and Lollipop Column Chart are freemium. All four listings use cloud deployment. graphomate matrix was updated on Jul 2026, compared with Dec 2025 for Innofalls Charts and Aug 2026 for both Flexa Tables and Lollipop Column Chart.
| Name | Pricing | Deployment | Updated |
|---|---|---|---|
| this plugin | Free | Cloud | |
| Innofalls Charts | Freemium | Cloud | |
| Flexa Tables | Freemium | Cloud | |
| Lollipop Column Chart | Freemium | Cloud |
1,008 plugins in Power BI · Analytics
Price distribution: 75 free, 112 freemium, 520 paid, 301 price not published
Power BI visual for building waterfall and bar charts through interactive navigation, drill downs, and dynamic comparisons.
Innofalls GmbH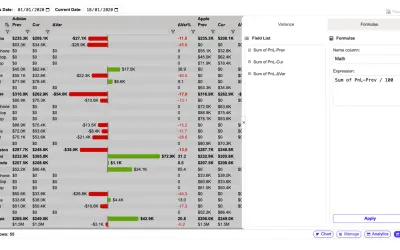
Adds pivoting, variance calculations, and header-based filtering to Power BI for end users of published reports.
FlexaIntel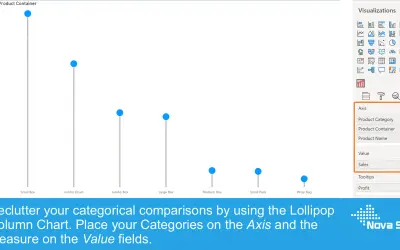
Lollipop Column Chart displays a marker and line per category as an alternative to standard column charts in Power BI.
Nova Silva
Gantt Chart is a project management visual for Microsoft Power BI that tracks schedules, milestones, and resource workloads.
ChartPad«Table Design According to IBCS • Clear Presentation Thanks to In-Cell Charts like Deviations and Sparklines • Flexible and Conditional Formatting for Each Column, Row or Single Cell • Performant and Interactive Display of Large Hierarchies in Rows and Columns • Calculation of Variances, Aggregations, Custom Formulae …»