Open IFC Viewer
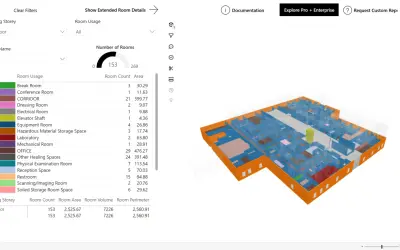
Power BI visual that parses IFC models locally, keeping BIM data private and secure with no uploads to external servers.
Flinker GmbHFreemiumCompare
147 analytics apps for Microsoft 365
Power BI visual that parses IFC models locally, keeping BIM data private and secure with no uploads to external servers.
Flinker GmbH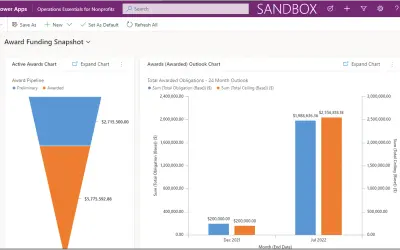
Manages funds, awards, projects, and workforce for nonprofits; deploys to an existing Dynamics 365 Sales environment.
Simple Actions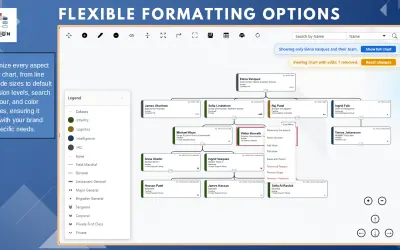
WorkforceVision Org Chart Drag & Drop enables drag-and-drop org design, scenario planning, and matrix reporting in Power BI.
WorkforceVision LTD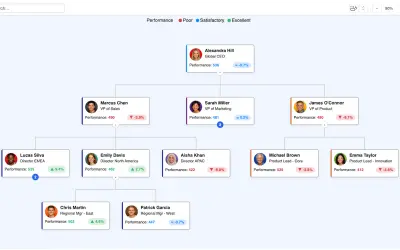
Organizational Chart visual for Microsoft 365 that maps teams, hierarchies, processes, and supply chains with KPI tracking.
ChartPad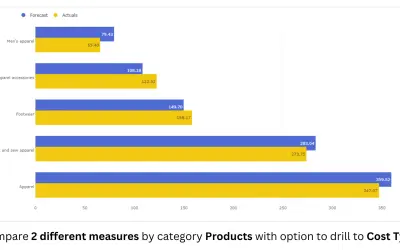
Overlapping Bar Chart (Pro) creates overlay bar variations such as thermometer and lipstick charts for Power BI reports.
PBIVizEdit.com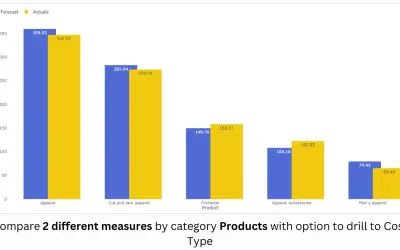
Power BI custom visual from PBIVizEdit for creating thermometer, lipstick, and patterned overlay column charts.
PBIVizEdit.com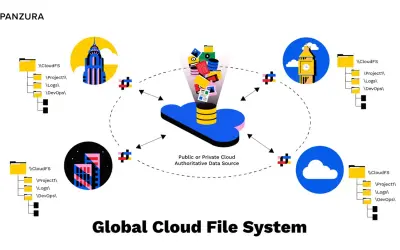
CloudFS and Symphony provide hybrid cloud file services and unified data management for Panzura's enterprise platform.
Panzura, LLC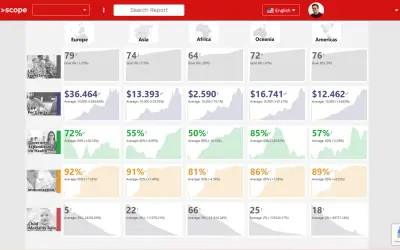
Reduces Azure consumption costs by sharing Power BI reports and dashboards with unlimited internal and external users.
DEVSCOPE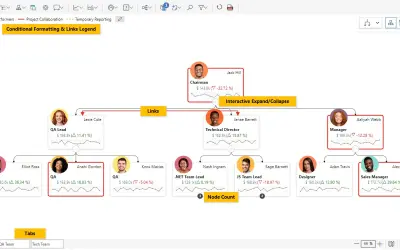
Power BI visual for tracking supply chain, sales, and financial performance with interactive diagrams, alerts, and KPIs.
xViz LLC dba Lumel
Pickit Business is a DAM system for Microsoft 365 that stores, organizes, and distributes digital assets across an organization.
Pickit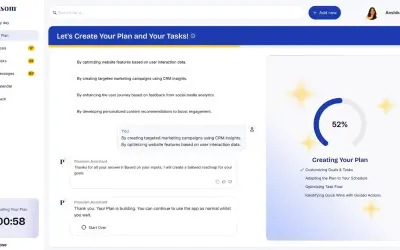
Plansom is an AI productivity engine for individuals, small teams, and enterprises that builds plans and executes tasks.
Plansom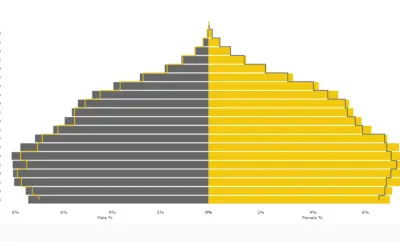
Population Pyramid (Pro) provides small multiple charts, analytics panels, and formatting controls for Power BI reports.
PBIVizEdit.com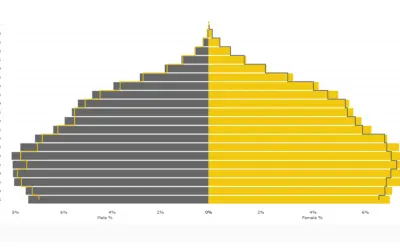
Displays population pyramids in Power BI with small multiples, an analytics panel, and bar and line formatting options.
PBIVizEdit.com
Creates visualizations from diverse chart types, combines multiple charts on one canvas, and adds custom annotations and tooltips.
Akvelon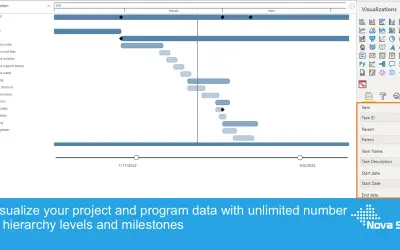
PowerGantt Chart visualizes project schedules, task dependencies, and milestones directly within Power BI reports.
Nova Silva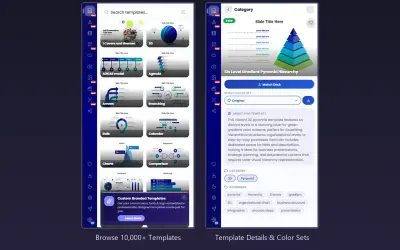
PowerPoint add-in providing 10,000+ templates, 200,000+ icons, and creative tools for building presentations in 9 languages.
PPT-DESIGN LTD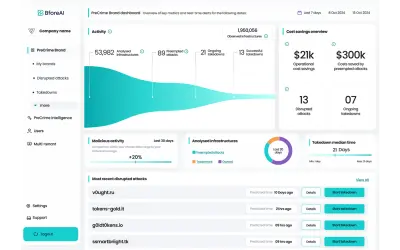
PreCrime Brand monitors the internet for malicious campaigns and neutralizes threats automatically via disruption and takedowns.
BforeAI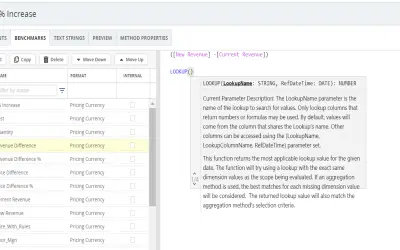
PROS Smart POM uses AI models and dynamic algorithms to deliver customer-specific prices across sales channels on Microsoft Azure.
PROS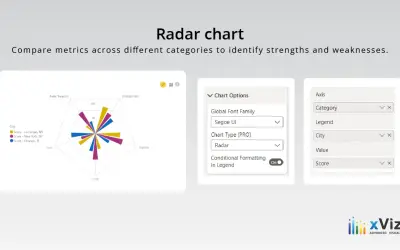
xViz Radar/Polar Chart projects multivariate data in a 360-degree view for analysis and comparison within Power BI reports.
xViz LLC dba Lumel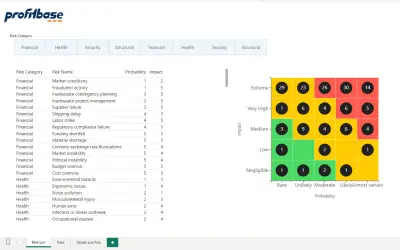
Risk Matrix by Profitbase visualizes risk exposure using configurable matrices, heatmaps, and bubble charts within Power BI.
Profitbase AS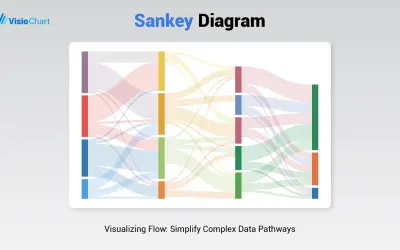
Creates Sankey diagrams with up to 12 levels in Microsoft Power BI, with customizable nodes, flows, colors, and text.
VisioChart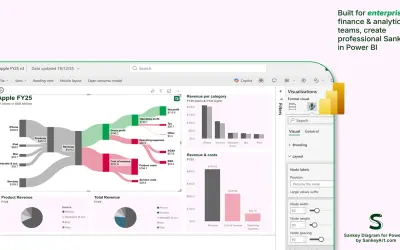
This Microsoft-certified Power BI visual creates Sankey diagrams of P&L statements, cash flows, sales, and cost breakdowns.
SankeyArt