
Gantt Chart
Gantt Chart is a project management visual for Microsoft Power BI that tracks schedules, milestones, and resource workloads.
ChartPadFree
Renders allow-listed HTML5 content beside figures in Power BI reports.
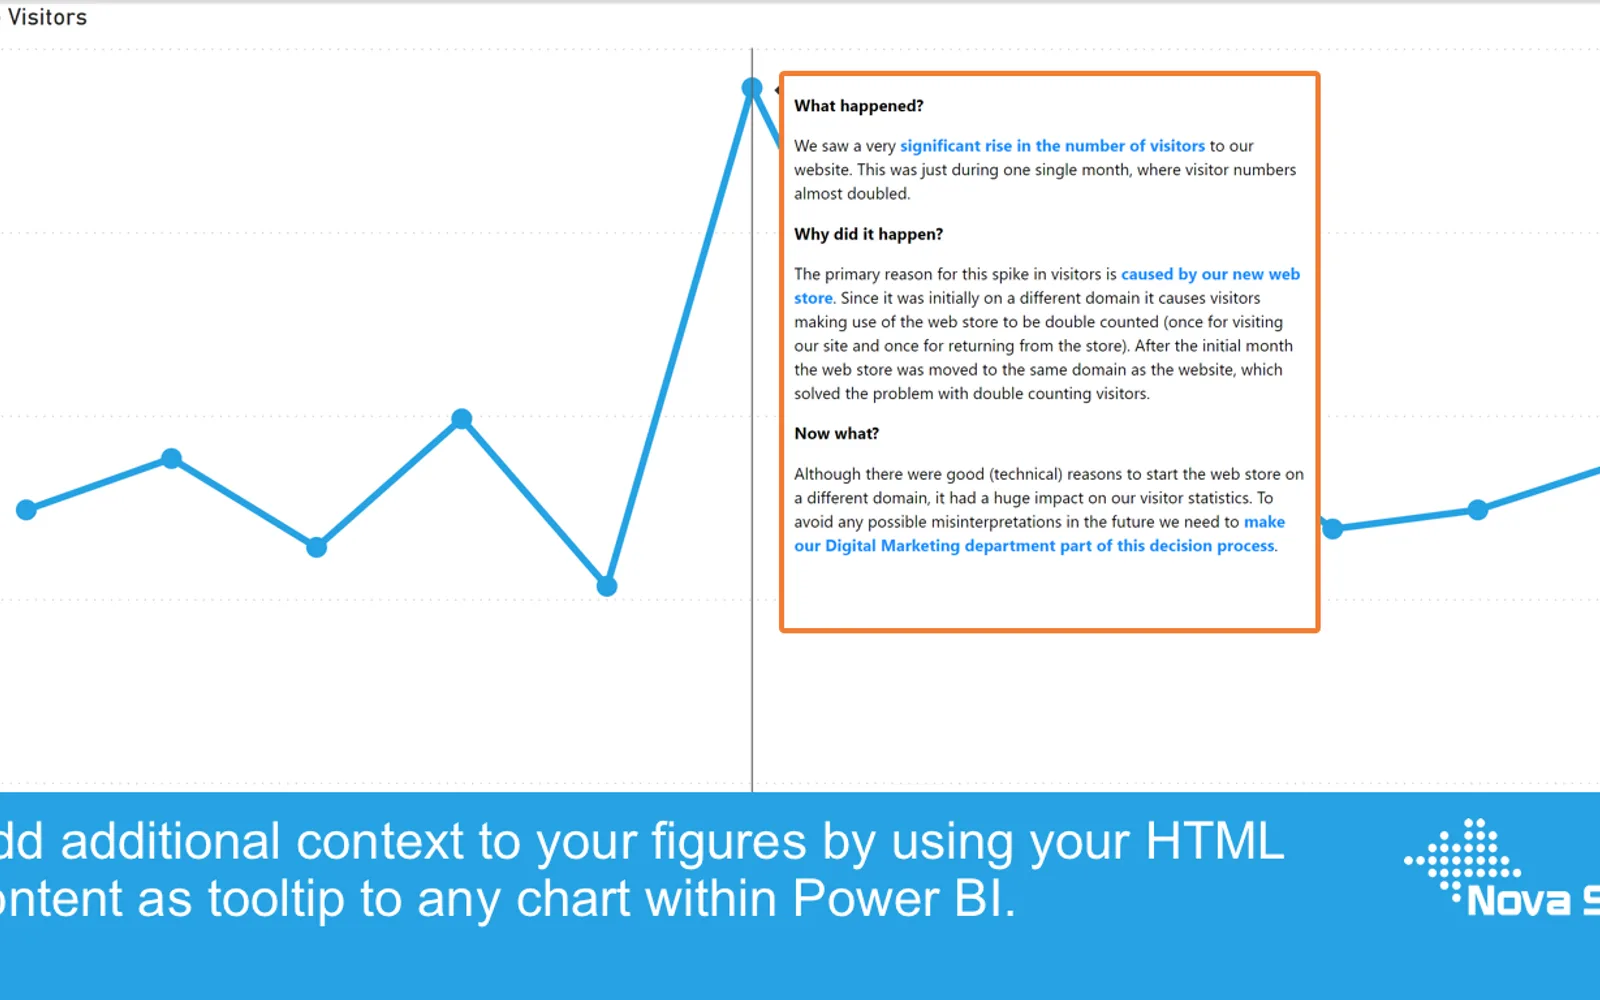
Displays HTML-formatted text next to figures in Power BI reports. It processes and renders only HTML tags and attributes included on its allow-list, ignoring others. Supported content includes headings, text blocks, inline formatting, links, and tables. Version 2.0 adds SVG tags, Data URLs for images, and NAV tags for report navigation.
Renders specified HTML5 elements, including headings, paragraphs, lists, inline formatting, and tables.
Processes only tags and attributes included on the product's allow-list.
Version 2.0 supports SVG tags.
Version 2.0 supports Data URLs for images.
Version 2.0 supports NAV tags for adding navigation to reports.
All functionality is available in Power BI Desktop, while a licensed version is required for sharing reports in Power BI Service.
657 plugins in Power BI · Analytics
Price distribution: 73 free, 108 freemium, 441 paid, 35 price not published
Gantt Chart is a project management visual for Microsoft Power BI that tracks schedules, milestones, and resource workloads.
ChartPad
Creates visualizations from diverse chart types, combines multiple charts on one canvas, and adds custom annotations and tooltips.
Akvelon
Creates financial and business reports in Power BI with automatic variance calculations, P&L logic, and drill-down (s5, s6).
Zebra BI
AI analysis app for Dynamics 365 Business Central that provides customer KPIs, churn probability, and customer grouping.
Data Courage«Most business applications allow users to enrich the data by adding additional context. Often, this additional context (like comments and feedback) is stored as HTML formatted text. This allows the user to not only include the content, but also apply all kinds of formatting to the content (like Bold, Italic, lists …»