
Bullet Chart - xViz
Power BI visual for comparing actuals against targets, with IBCS-certified bullet chart templates and comparison bands.
xViz LLC dba LumelFreemium
Adds a population pyramid visual with small multiples and analytics features to Power BI.
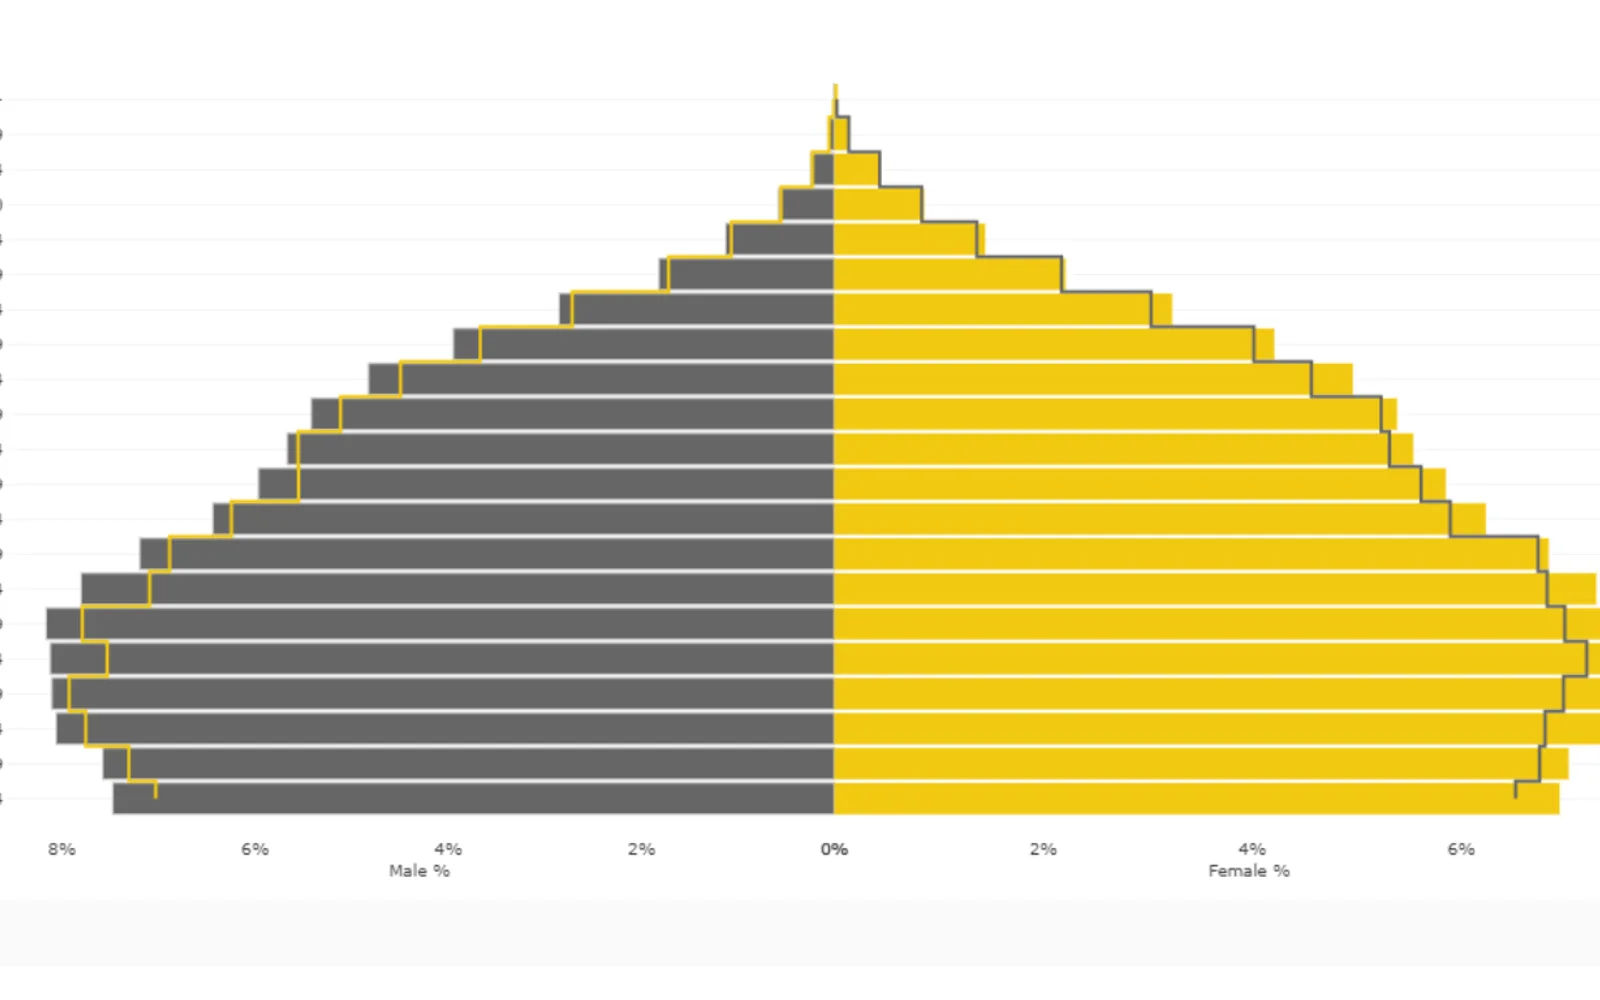
Adds a population pyramid visual to Power BI. It supports small multiples and an analytics panel with reference lines, reference bands, and error bars. Line formatting includes color, width, transparency, style, and shape options. Bar formatting includes border color and border width options, alongside tooltip pages and drill-down features.
Supports small multiple and trellis layouts.
Includes reference lines, reference bands, and error bars.
Allows changes to line color, width, transparency, style, and shape.
Allows changes to bar border color and border width.
Supports tooltip pages and drill-down features.
Population Pyramid (Pro) and Bullet Chart - xViz both use freemium pricing and cloud deployment. Ridgeline Plot by Powerviz is free and cloud-deployed. Lollipop Column Chart, Drill Down Map PRO (Filter) by ZoomCharts, and Drill Down Combo PRO (Pin) by ZoomCharts use freemium pricing and cloud deployment.
| Name | Pricing | Deployment | Updated |
|---|---|---|---|
| this plugin | Freemium | Cloud | |
| Bullet Chart - xViz | Freemium | Cloud | |
| Ridgeline Plot by Powerviz | Free | Cloud | |
| Lollipop Column Chart | Freemium | Cloud | |
| Drill Down Map PRO (Filter) by ZoomCharts | Freemium | Cloud | |
| Drill Down Combo PRO (Pin) by ZoomCharts | Freemium | Cloud |
877 plugins in Power BI · Analytics
Price distribution: 74 free, 113 freemium, 497 paid, 193 price not published
Power BI visual for comparing actuals against targets, with IBCS-certified bullet chart templates and comparison bands.
xViz LLC dba Lumel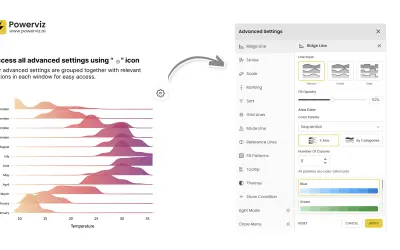
Custom Power BI visual that plots numeric distributions for multiple categories as stacked curves along a common continuous axis.
TRUVIZ INC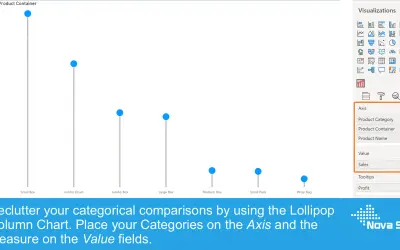
Lollipop Column Chart displays a marker and line per category as an alternative to standard column charts in Power BI.
Nova Silva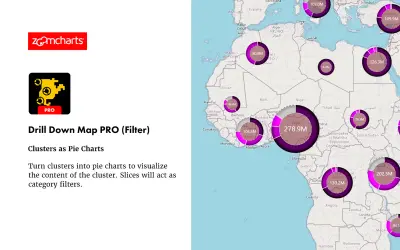
Drill Down Map PRO (Filter) by ZoomCharts visualizes and filters location data on interactive maps for Power BI Desktop reports.
ZoomCharts«Description FEATURES AVAILABLE With Population Pyramid (Pro) • Small multiple/Trellis • Analytics Panel - Reference line and bands, Error bar • Modify line color, transparency, bar border colour and width • Line formatting for color, width, transparency, style and shape • Small Multiples • General Power BI features …»