Drill Down Network PRO (Pin) by ZoomCharts
Drill Down Network PRO (Pin) by ZoomCharts renders interactive category-based network charts with drill-down support in Power BI.
ZoomChartsFreemium
Create interactive org charts, process diagrams, and hierarchy views in Power BI.
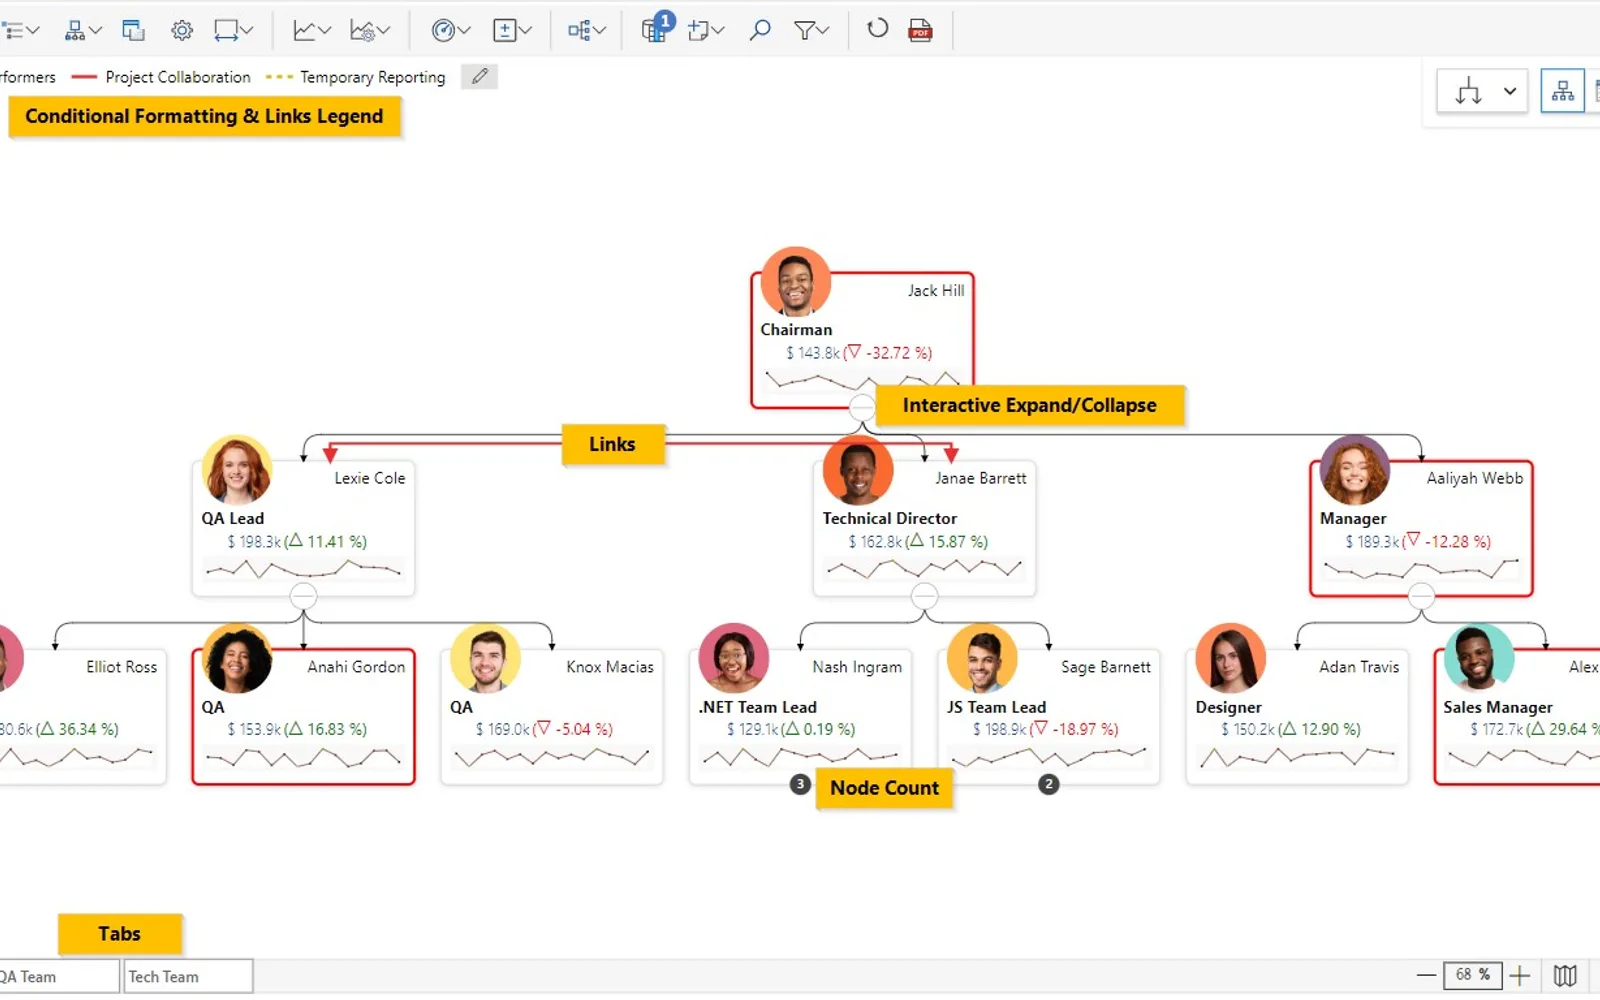
Performance Flow adds interactive process, organization, and hierarchy visuals to Power BI without code. It can display organizational relationships with profile details, alerts, and KPIs, as well as supply chain, network, sales, and financial data. Process views can use swim lanes and connectors. Users can search, filter, zoom, expand or collapse levels, inspect subtrees, and view node details.
Shows profile photos, names, titles, designations, alerts, and KPIs for stakeholders in organizational structures.
Displays business processes and flows with custom swim lanes and connectors.
Shows supply chain, network, sales, and financial performance across the dimensions named in the listing.
Provides level expansion and collapse, zoom controls, a mini-map, and navigation within diagrams.
Finds nodes in diagrams containing a large number of nodes.
Filters diagram content according to observations and KPIs.
Accepts Id and Parent Id columns or separate columns for multiple hierarchy levels.
Performance Flow is freemium and cloud deployed, as are Drill Down Network PRO (Pin) by ZoomCharts and Sunburst Chart. Xero Planning & Reporting by Acterys is paid and cloud deployed, while Zentrix Network Graph is free and cloud deployed. Performance Flow was updated on Dec 2025; the listed update dates for Drill Down Network PRO (Pin) by ZoomCharts, Zentrix Network Graph, and Drill Down Combo Bar PRO (Filter) by ZoomCharts are Aug 2026.
| Name | Pricing | Deployment | Updated |
|---|---|---|---|
| this plugin | Freemium | Cloud | |
| Drill Down Network PRO (Pin) by ZoomCharts | Freemium | Cloud | |
| Sunburst Chart | Freemium | Cloud | |
| Xero Planning & Reporting by Acterys | Paid | Cloud | |
| Zentrix Network Graph | Free | Cloud | |
| Drill Down Combo Bar PRO (Filter) by ZoomCharts | Freemium | Cloud |
657 plugins in Power BI · Analytics
Price distribution: 73 free, 108 freemium, 441 paid, 35 price not published
Drill Down Network PRO (Pin) by ZoomCharts renders interactive category-based network charts with drill-down support in Power BI.
ZoomCharts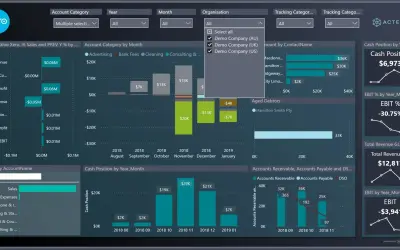
Xero reporting and planning app for Power BI and Excel with pre-built templates, dashboards, and two-way integration.
Managility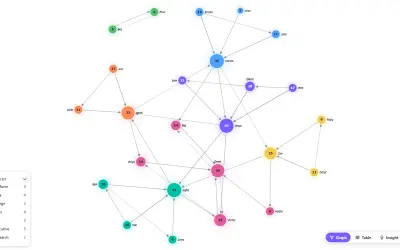
Zentrix Network Graph renders deterministic node-edge layouts inside Power BI with cross-filtering and graph analytics.
Zentrix Studio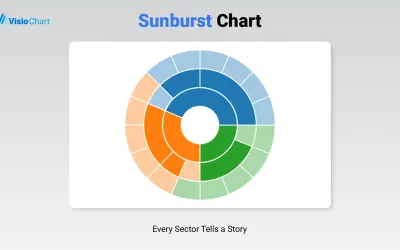
Displays up to five levels of hierarchical data as proportional segments across concentric rings in Power BI reports.
VisioChart«Build Power BI reports with interactive process org charts, process diagrams, and hierarchies without writing any code using xViz Performance Flow. Use cases supported: • Organization charts: Deliver org charts with integrated alerts and KPIs. Supports profile photo, name, title & designation details for stakeholders …»