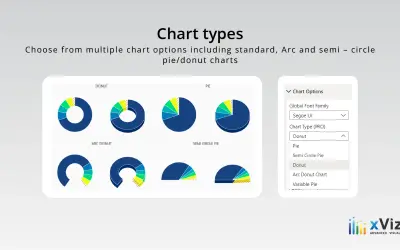
Advanced Pie and Donut - xViz
An xViz pie and donut chart for Power BI that compares parameters and displays each part's proportion of the whole.
xViz LLC dba LumelFreemium
Create and customize up to 12-level Sankey diagrams in Microsoft Power BI.
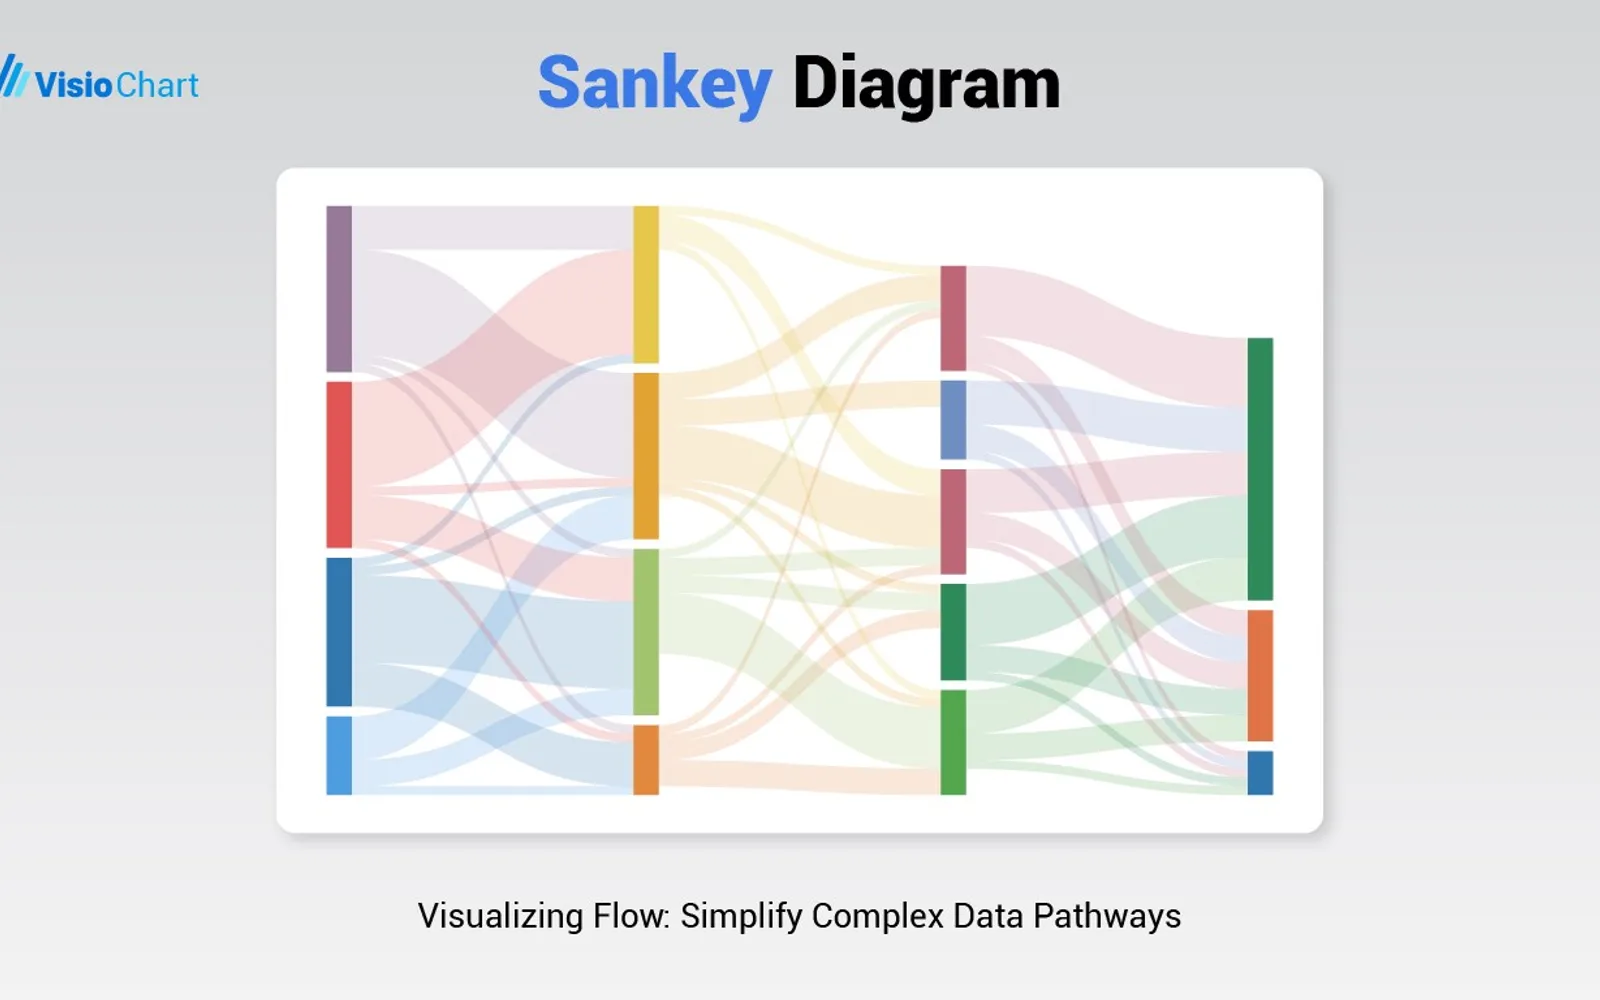
Sankey Diagram for Power BI visualizes data flows using nodes and flows. It supports diagrams with up to 12 levels and lets users customize nodes, flows, statistics, text, and colors. The vendor states that it can be used in Power BI Web, Power BI Desktop, and Power BI for Mac. The vendor also states that data is not stored on its platform.
Creates Sankey diagrams with up to 12 levels.
Represents stages and relationships through nodes and flows.
Provides settings for nodes, flows, statistics, text, and colors.
Allows one developer to create, customize, and publish dashboards under the stated developer plan.
The stated Enterprise Developer Plan supports sharing dashboards with unlimited viewers.
Individual customers and enterprises.
Sankey Diagram is freemium and cloud-deployed, matching Advanced Pie and Donut - xViz and Performance Flow - xViz, which were also updated in Dec 2025. It differs from dynamic commerce Power BI Dashboard and Power BI Analytics, which are paid and cloud-deployed; those listings were updated in Oct 2025 and Aug 2026, respectively. Sift has an unknown pricing model, cloud deployment, and a May 2025 update date.
| Name | Pricing | Deployment | Updated |
|---|---|---|---|
| this plugin | Freemium | Cloud | |
| Advanced Pie and Donut - xViz | Freemium | Cloud | |
| Performance Flow - xViz | Freemium | Cloud | |
| dynamic commerce Power BI Dashboard | Paid | Cloud | |
| Power BI Analytics | Paid | Cloud | |
| Sift | Price not published | Cloud |
1,365 plugins in Power BI · Analytics
Price distribution: 89 free, 137 freemium, 651 paid, 488 price not published
An xViz pie and donut chart for Power BI that compares parameters and displays each part's proportion of the whole.
xViz LLC dba Lumel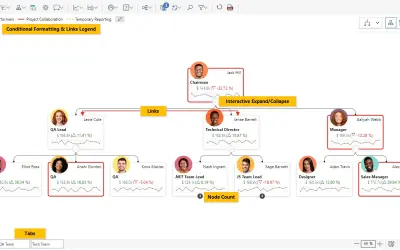
Power BI visual for tracking supply chain, sales, and financial performance with interactive diagrams, alerts, and KPIs.
xViz LLC dba Lumel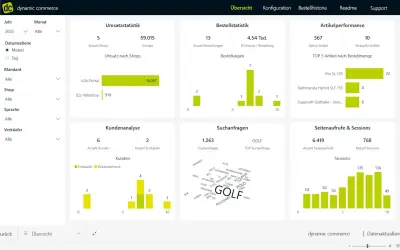
Power BI dashboard for the dynamic commerce platform that reports on shop sales, product performance, orders, and customers.
dc AG
Sift provides an interactive org chart, employee profiles, and instant people search within Microsoft Teams and Outlook.
Sift, LLC«Based on user interest, we have introduced new pricing packages. For developers looking to share across their organization with unlimited viewers, we recommend: • Enterprise Developer Plan • Enterprise Reseller Plan (a discounted option for teams with more than 5 developers) For smaller organizations or individual …»