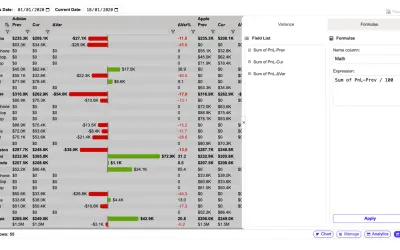
Flexa Tables
Adds pivoting, variance calculations, and header-based filtering to Power BI for end users of published reports.
FlexaIntelFreemium
Visualize organizational structures and track KPIs in Power BI.
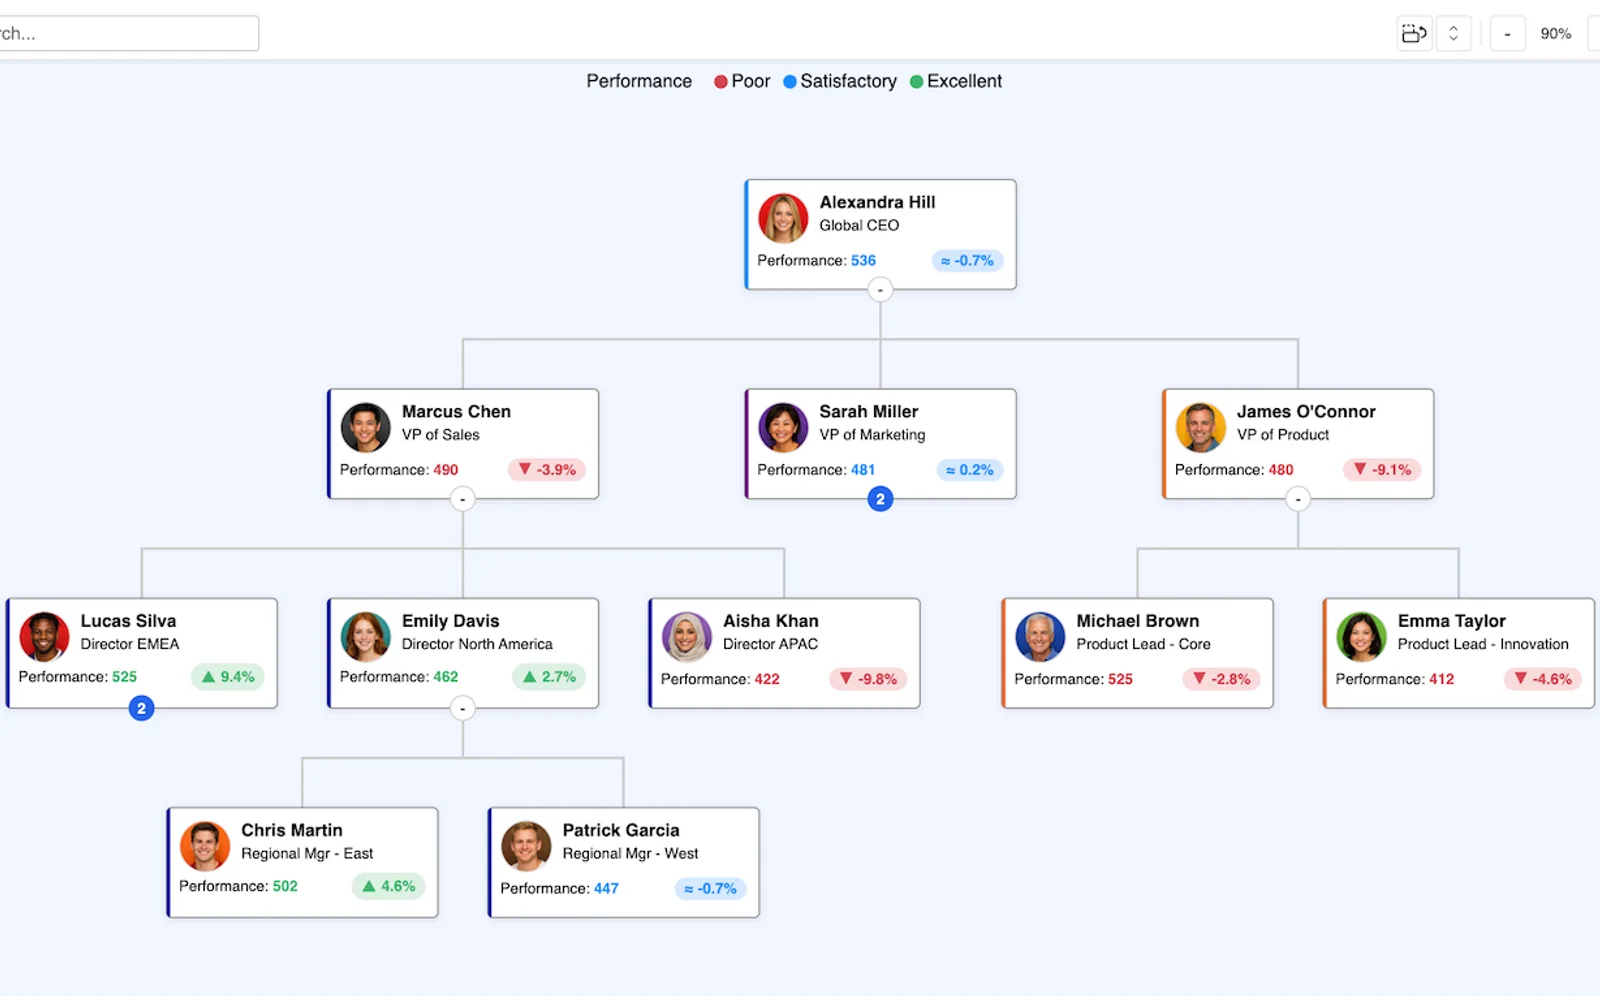
This Power BI visual displays company structures, production lines, project teams, processes, and supply chains as interactive hierarchies. It overlays KPI measures on nodes and shows variance with colour-coded formatting. Users can search and highlight nodes, switch between top-down and left-to-right layouts, and group nodes into swimlanes. The visual also supports photos, expand/collapse controls, focus mode, cross-filtering, multi-selection, customizable targets, and dark mode.
Displays KPI measures on nodes with colour-coded variance analysis.
Filters and highlights nodes across large hierarchies.
Switches between top-down and left-to-right views.
Groups nodes into vertical or horizontal swimlanes.
Provides expand/collapse controls and a focus mode for large structures.
Supports filtering other visuals and selecting multiple nodes.
Defines target measures for dynamic formatting and variance calculations.
Offers a dark display mode.
It is named for HR and operations managers, executive leadership, financial analysts, operations and manufacturing managers, supply chain leads, and project managers.
Organizational Chart is freemium and cloud-deployed, as are Flexa Tables and Dual Y-Axis Combo Chart (Pro) for Power BI. Organimi is paid and cloud-deployed, while Sift and FastOrg have an unknown pricing type and cloud deployment.
| Name | Pricing | Deployment | Updated |
|---|---|---|---|
| this plugin | Freemium | Cloud | |
| Flexa Tables | Freemium | Cloud | |
| Dual Y-Axis Combo Chart (Pro) for Power BI | Freemium | Cloud | |
| Organimi | Paid | Cloud | |
| Sift | Price not published | Cloud | |
| FastOrg | Price not published | Cloud |
923 plugins in Microsoft 365 · Analytics
Price distribution: 32 free, 48 freemium, 331 paid, 512 price not published
Adds pivoting, variance calculations, and header-based filtering to Power BI for end users of published reports.
FlexaIntel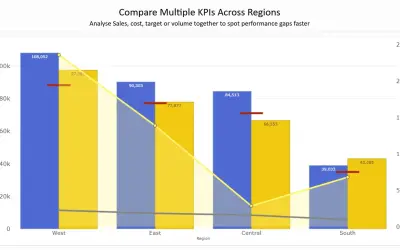
Combines column, line, area, and scatter charts on dual Y-axes to compare up to 8 metrics in a single Power BI visual.
PBIVizEdit.com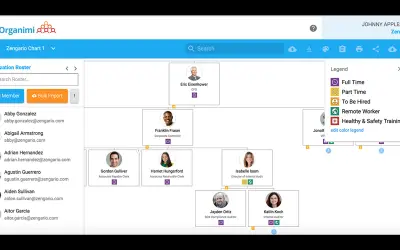
Organimi is purpose-built org chart software for creating, sharing, and printing organizational charts for your workplace.
Organimi
Sift provides an interactive org chart, employee profiles, and instant people search within Microsoft Teams and Outlook.
Sift, LLC«Visualize your organization's structure and monitor performance in a single, dynamic org chart. Perfect for mapping teams, hierarchies, processes, and supply chains — with built-in KPI tracking. Unlock the full power of organizational clarity. The Org Chart visual combines the simplicity of a classic hierarchy diagram …»