
Gantt Chart
Gantt Chart is a project management visual for Microsoft Power BI that tracks schedules, milestones, and resource workloads.
ChartPadFree
Creates varied charts in Power BI, with combined views and options for annotations, shapes, tooltips, and HTML text.
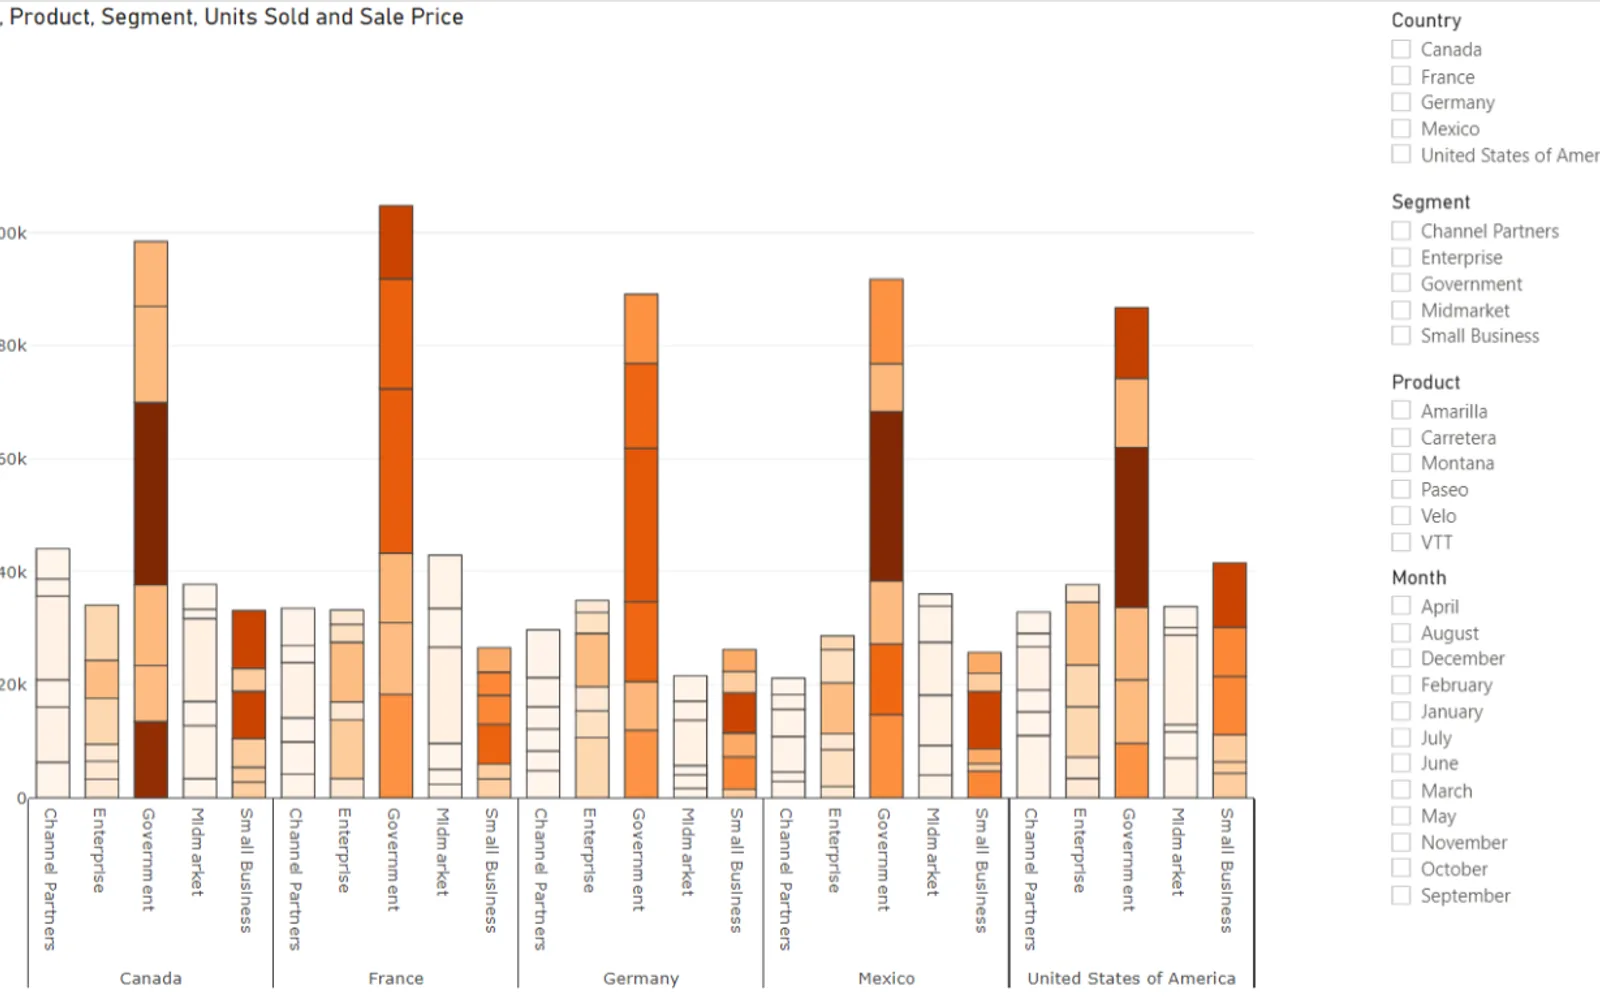
Adds many chart formats to Power BI, including line, scatter, bar, pie, box, histogram, heatmap, contour, ternary, ribbon, indicator, funnel, and 3D views. It can place several charts together and supports annotations, shapes, tooltips, and HTML text.
Includes line, scatter, bar, pie, box, histogram, heatmap, contour, ternary, ribbon, indicator, funnel, and 3D views.
Places several charts together within one visual area.
Provides custom annotations, shapes, tooltips, and HTML text options.
2,531 plugins in Power BI · Analytics
Price distribution: 125 free, 147 freemium, 1,350 paid, 909 price not published
Gantt Chart is a project management visual for Microsoft Power BI that tracks schedules, milestones, and resource workloads.
ChartPad
Creates financial and business reports in Power BI with automatic variance calculations, P&L logic, and drill-down (s5, s6).
Zebra BI
AI analysis app for Dynamics 365 Business Central that provides customer KPIs, churn probability, and customer grouping.
Data Courage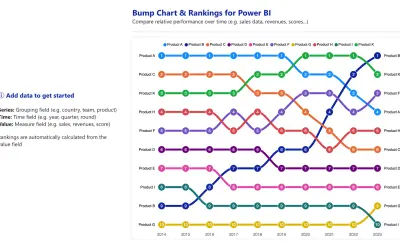
Bump Chart and Rankings tracks how metrics, entities, or categories change rank over time within Power BI reports.
ChartPad«line charts, scatter plots, bar charts, waterfall bar charts, pie charts, donut charts, bubble charts, error bars charts, box plots, horizontal box plots, grouped box plots, histograms, stacked histograms, 2D density plots, heatmaps, waterfall charts, indicators, funnel charts, contour plots, ternary plots, ribbon …»