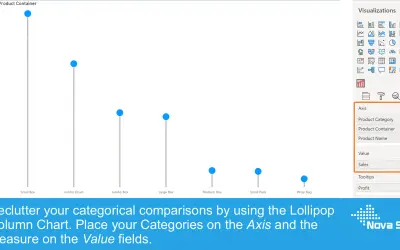
Lollipop Column Chart
Lollipop Column Chart displays a marker and line per category as an alternative to standard column charts in Power BI.
Nova SilvaFreemium
Create overlapping bar variations in Power BI, including thermometer, lipstick, and patterned bar charts.
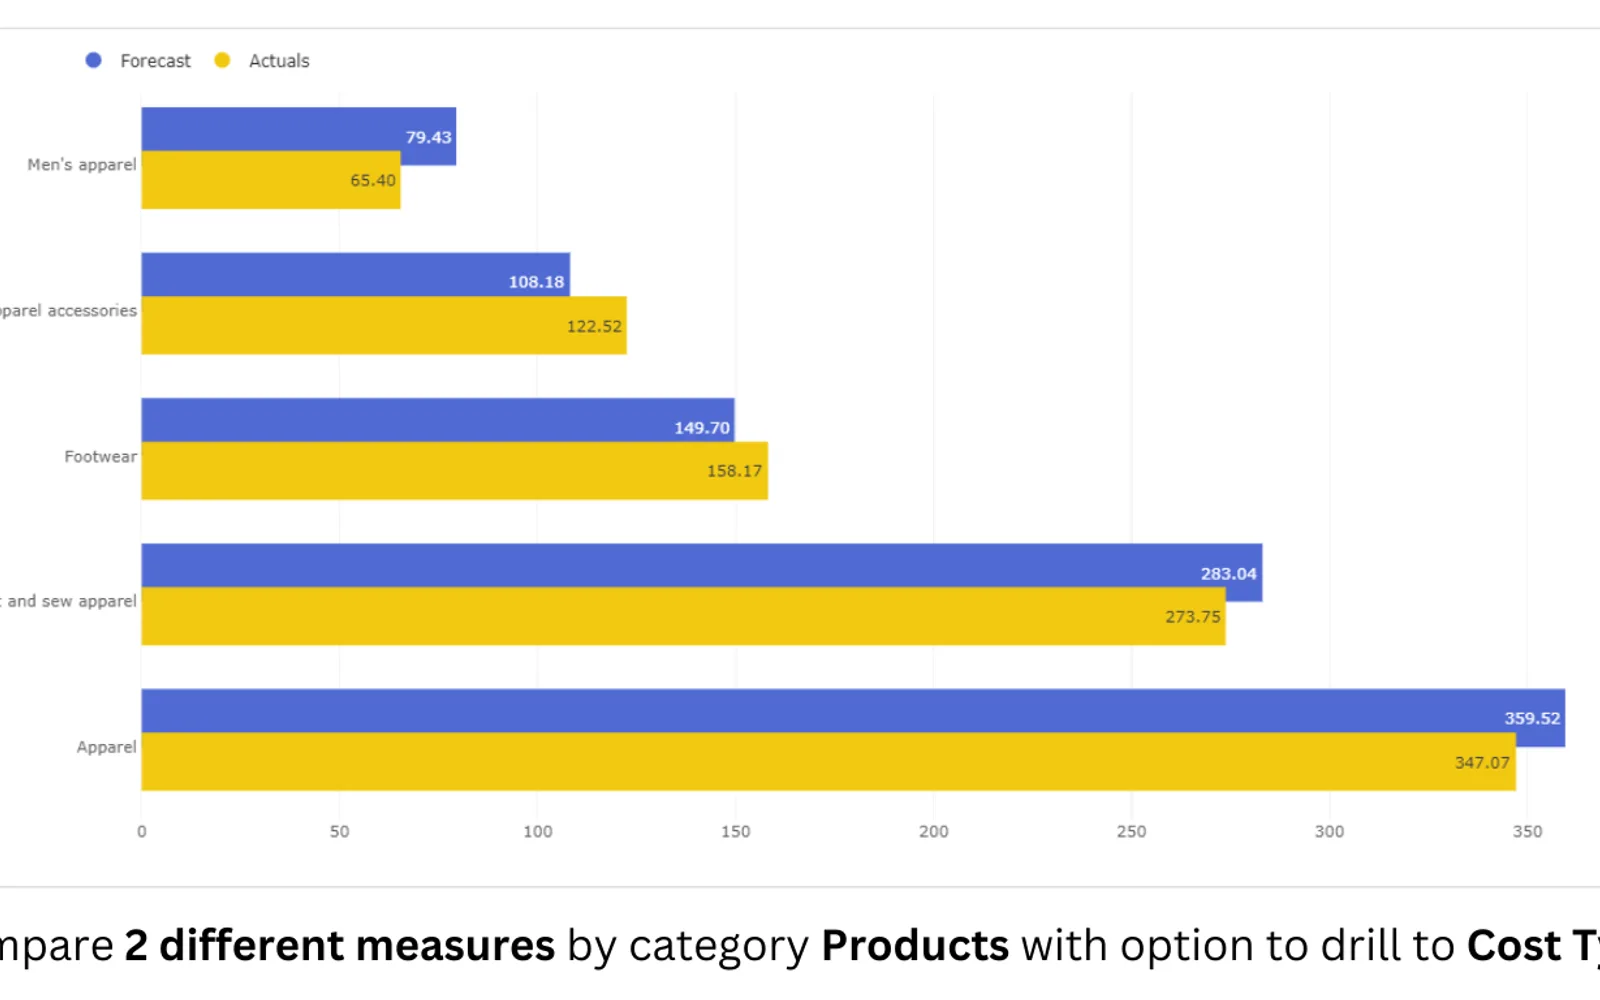
Creates overlay bar chart variations in Power BI, including thermometer, lipstick, and patterned bar charts. It supports small multiples, reference lines and bands, error bars and bands, and changes to bar offset, width, colour, and transparency. The visual also supports pattern formatting, custom label formatting, tooltip pages, and drill-down.
Creates thermometer, lipstick, and patterned bar chart variations.
Provides small multiple, also called trellis, layouts.
Includes reference lines and bands, plus error bars and bands.
Allows modification of bar offset, width, colour, and transparency.
Supports formatting bars with patterns.
Provides custom formatting for labels.
Supports tooltip pages and drill-down features.
Overlapping Bar Chart (Pro) and Lollipop Column Chart are both freemium cloud listings, while Ridgeline Plot by Powerviz is free and cloud-based. Overlapping Bar Chart (Pro) was updated on Dec 2025, while Lollipop Column Chart and Ridgeline Plot by Powerviz were updated on Aug 2026 and Jul 2026. Drill Down Combo Bar PRO (Filter) by ZoomCharts, Bullet Chart - xViz, and Drill Down Combo PRO (Pin) by ZoomCharts are also freemium cloud listings; the two ZoomCharts listings were updated on Aug 2026 and Bullet Chart - xViz on Dec 2025.
| Name | Pricing | Deployment | Updated |
|---|---|---|---|
| this plugin | Freemium | Cloud | |
| Overlapping Bar Chart | Paid | Cloud | |
| Lollipop Column Chart | Freemium | Cloud | |
| Ridgeline Plot by Powerviz | Free | Cloud | |
| Drill Down Combo Bar PRO (Filter) by ZoomCharts | Freemium | Cloud | |
| Bullet Chart - xViz | Freemium | Cloud | |
| Drill Down Combo PRO (Pin) by ZoomCharts | Freemium | Cloud |
877 plugins in Power BI · Analytics
Price distribution: 74 free, 113 freemium, 497 paid, 193 price not published
Lollipop Column Chart displays a marker and line per category as an alternative to standard column charts in Power BI.
Nova Silva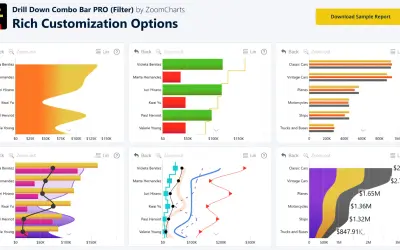
Sign up for a Free Developer License and get 1 year access to this and 20+ ZoomCharts visuals for use in Power BI Desktop!
ZoomCharts
Power BI visual for comparing actuals against targets, with IBCS-certified bullet chart templates and comparison bands.
xViz LLC dba Lumel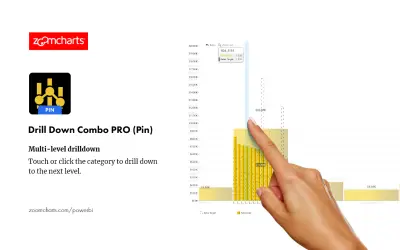
Adds column, line, and area chart types per series to Power BI dashboards, with stacking, clustering, and thresholds.
ZoomCharts«Description Using PBIVizEdit's Overlapping Bar (Pro) visual you can create, variations of overlay bars. For example, • Thermometer bar chart • Lipstick bar chart • Bar chart with patterns FEATURES AVAILABLE • Small multiple/Trellis • Analytics Panel - Reference line and bands, Error bar and bands • Modify bar offset …»