
Bullet Chart - xViz
Power BI visual for comparing actuals against targets, with IBCS-certified bullet chart templates and comparison bands.
xViz LLC dba LumelFreemium
Power BI visual with small multiples, reference lines, bands, and error bars.
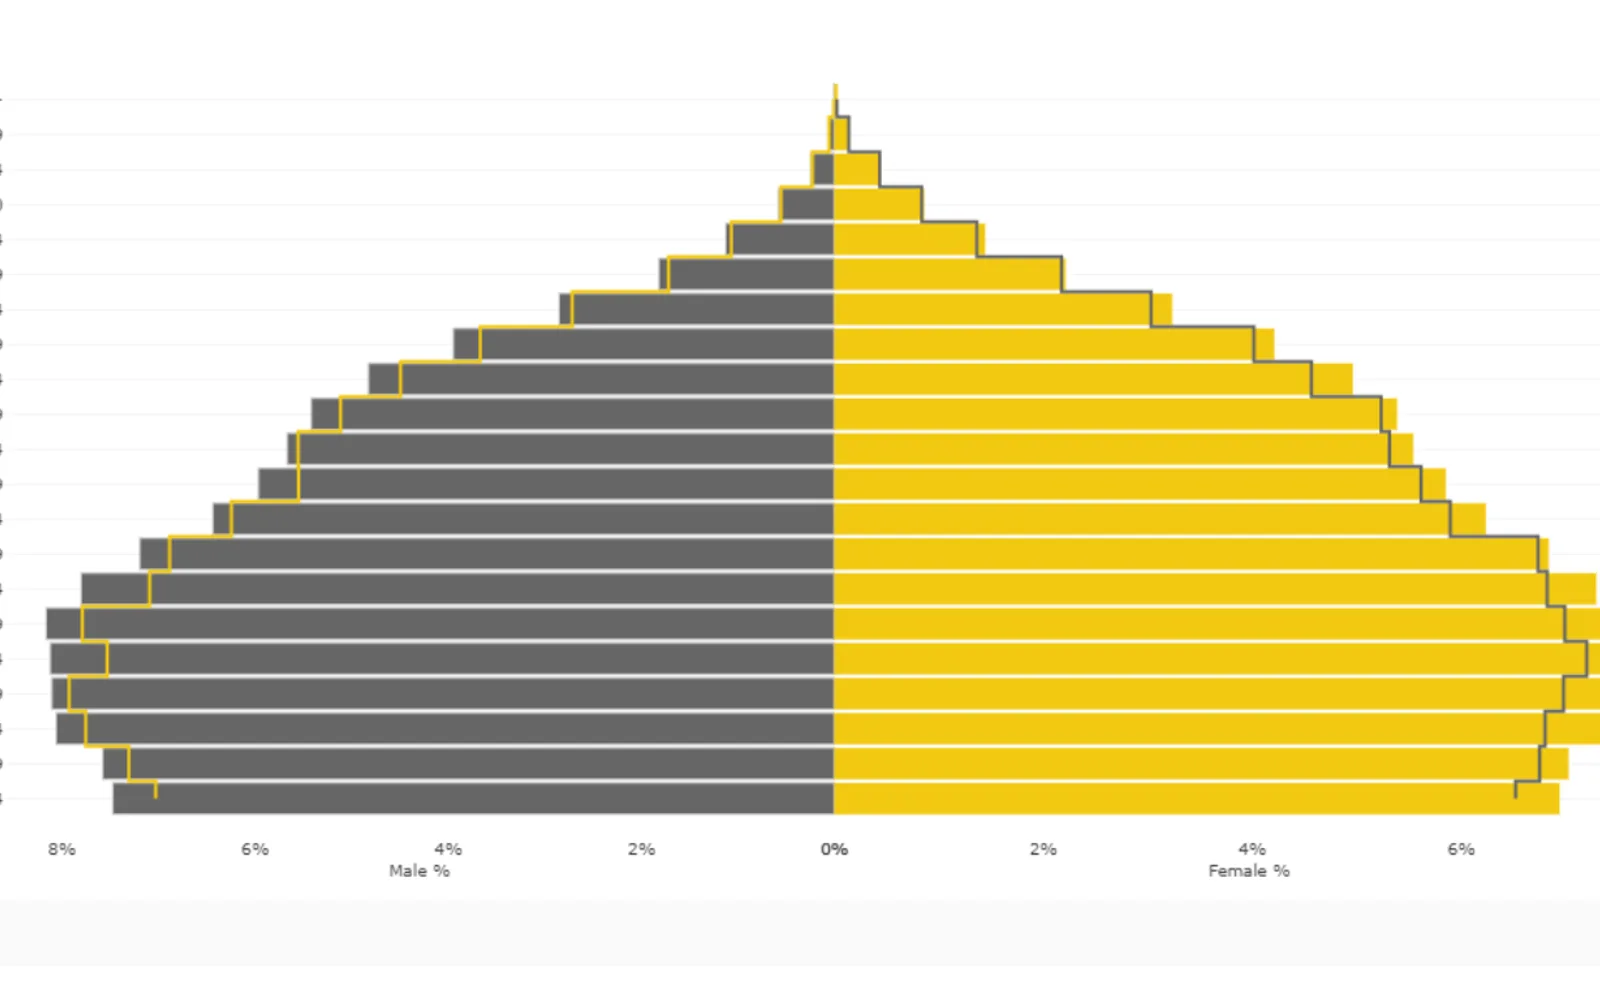
Provides a population pyramid visual for Power BI. It includes small multiple and trellis layouts, an analytics panel with reference lines and bands, and error bars. Formatting options include line color, transparency, width, style, shape, and bar border color and width. The visual also supports tooltip pages and drill-down.
Supports small multiple and trellis layouts.
Includes reference lines, reference bands, and error bars.
Supports changes to bar border color and width.
Supports changes to line color, width, transparency, style, and shape.
Supports tooltip pages and drill-down.
The vendor names IT teams as a group that can verify the visual's access to external services or resources.
Population Pyramid (Standard) and Bullet Chart - xViz both use freemium pricing and cloud deployment. Ridgeline Plot by Powerviz is free and cloud-deployed, while Multi Line Chart with Tooltips is paid and cloud-deployed. Lightning Tools Data Viewer has an unknown pricing model and cloud deployment.
| Name | Pricing | Deployment | Updated |
|---|---|---|---|
| this plugin | Freemium | Cloud | |
| Bullet Chart - xViz | Freemium | Cloud | |
| Ridgeline Plot by Powerviz | Free | Cloud | |
| Multi Line Chart with Tooltips | Paid | Cloud | |
| Lightning Tools Data Viewer | Price not published | Cloud |
877 plugins in Power BI · Analytics
Price distribution: 74 free, 113 freemium, 497 paid, 193 price not published
Power BI visual for comparing actuals against targets, with IBCS-certified bullet chart templates and comparison bands.
xViz LLC dba Lumel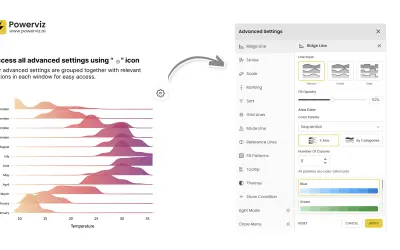
Custom Power BI visual that plots numeric distributions for multiple categories as stacked curves along a common continuous axis.
TRUVIZ INC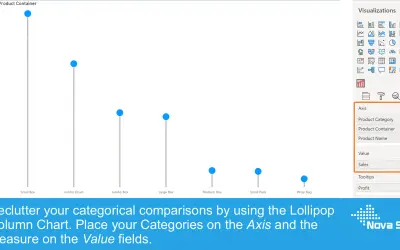
Lollipop Column Chart displays a marker and line per category as an alternative to standard column charts in Power BI.
Nova Silva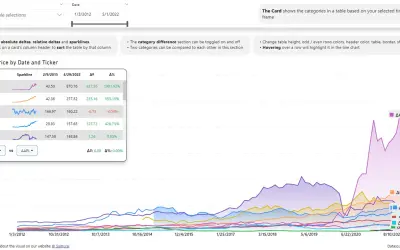
Power BI visual that compares categories over time, with YoY, MoM, YTD and MTD calculations, deltas and sparklines.
Datanauts«This visual is not certified by Microsoft Power BI team. If you want the certified version of this visual, please check Population Pyramid (Pro). Please note all our Pro visuals can be exported to PPT/PDF. All of our visuals, including those not certified by Microsoft, do not access any external services or resources …»