Control Chart
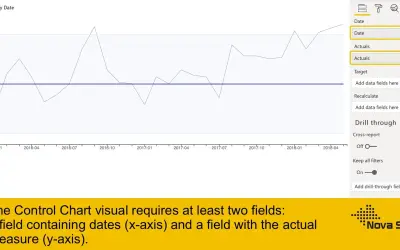
Control Chart renders X and mR charts with automatic or manual recalculation rules as a custom visual for Power BI.
Nova SilvaPaidCompare
10 apps
Control Chart renders X and mR charts with automatic or manual recalculation rules as a custom visual for Power BI.
Nova Silva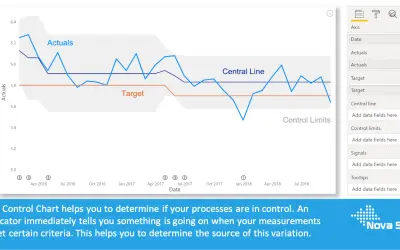
Control Chart XmR determines if processes are in control by detecting signals using Wheeler or Nelson rules in Power BI.
Nova Silva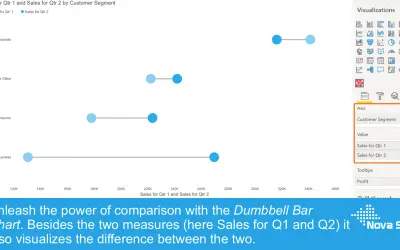
A Power BI visual that compares two results using a marker per value connected by a line, with an optional variance chart.
Nova Silva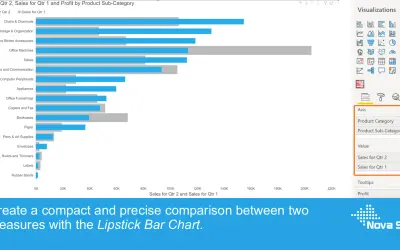
Lipstick Bar Chart overlays a primary and secondary measure per category as a Power BI visual for precise value comparison.
Nova Silva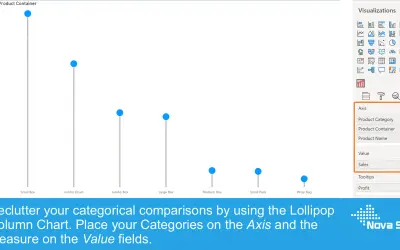
Lollipop Column Chart displays a marker and line per category as an alternative to standard column charts in Power BI.
Nova Silva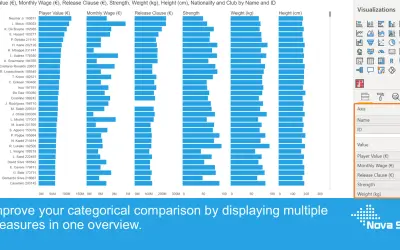
Merged Bar Chart displays up to 12 independent measures per category in a single visual for Power BI Desktop and Service.
Nova Silva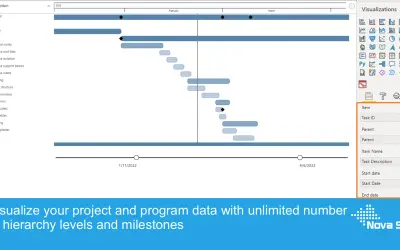
PowerGantt Chart visualizes project schedules, task dependencies, and milestones directly within Power BI reports.
Nova Silva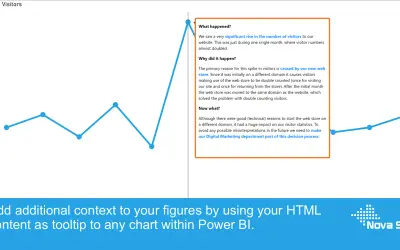
Renders only allow-listed HTML tags and attributes in Power BI reports to mitigate security risks such as inline scripting.
Nova Silva