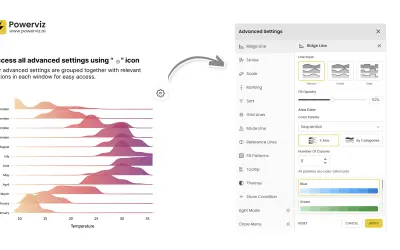
Ridgeline Plot by Powerviz
Custom Power BI visual that plots numeric distributions for multiple categories as stacked curves along a common continuous axis.
TRUVIZ INCFree
Compare up to 12 measures for each category in a Power BI visual using separate, sortable bars.
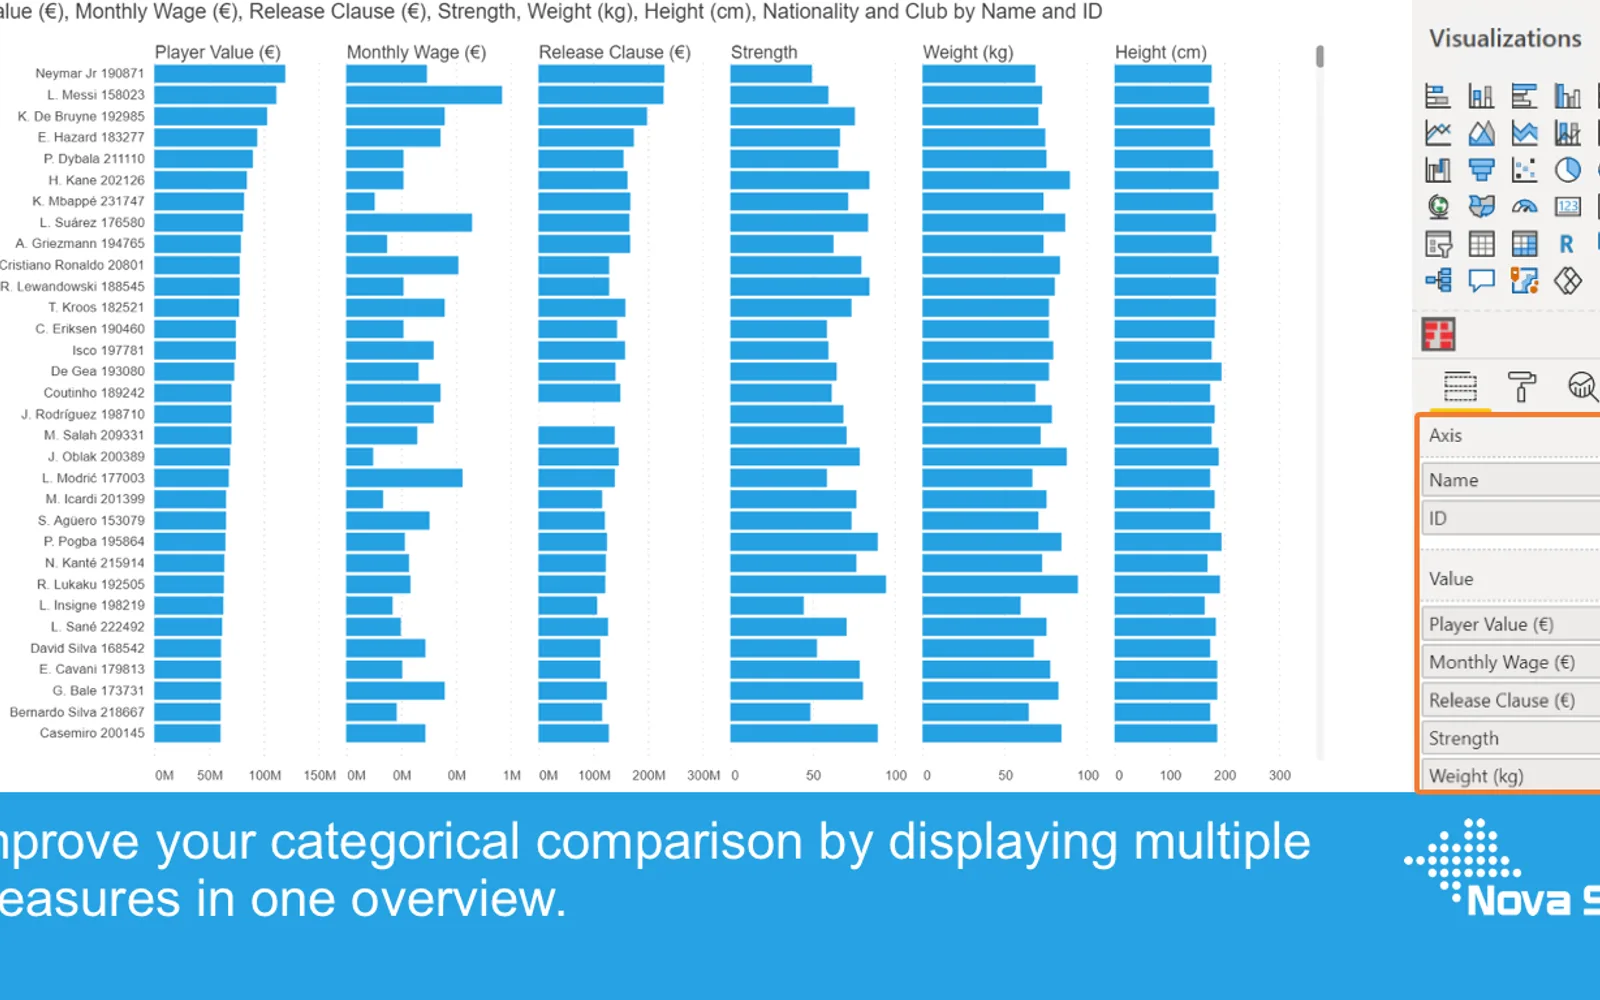
Merged Bar Chart presents several measures for each category as separate bars within Power BI. It supports up to 12 measures per category and sorting by any measure. The visual includes independent series formatting, selection, highlighting, context-menu actions, tooltips, bookmarks, and conditional formatting. Desktop use is free, while sharing reports in Power BI Service requires a license.
Shows up to 12 independent measures for each category in one visual.
Sorts displayed categories by any measure column.
Formats each bar series independently and supports theme settings.
Supports selection and highlighting functions within the visual.
Provides context-menu actions including drill down and including or excluding data points.
Adds additional fields to the tooltip alongside the default element value.
Supports conditional formatting for datapoint colors.
Merged Bar Chart uses a freemium pricing model and cloud deployment. Ridgeline Plot by Powerviz is free, while Multi Line Chart with Tooltips and 100% Clustered Stacked Bar Chart (Standard) are paid; all three are cloud-deployed. Merged Bar Chart and Ridgeline Plot by Powerviz show an update month of Jul 2026, while Multi Line Chart with Tooltips shows Jan 2025 and 100% Clustered Stacked Bar Chart (Standard) shows Apr 2024. Bullet Chart - xViz is also freemium, cloud-deployed, and shows Dec 2025.
| Name | Pricing | Deployment | Updated |
|---|---|---|---|
| this plugin | Freemium | Cloud | |
| Ridgeline Plot by Powerviz | Free | Cloud | |
| Multi Line Chart with Tooltips | Paid | Cloud | |
| 100% Clustered Stacked Bar Chart (Standard) | Not in catalog | ||
| Bullet Chart - xViz | Freemium | Cloud | |
657 plugins in Power BI · Analytics
Price distribution: 73 free, 108 freemium, 441 paid, 35 price not published
Custom Power BI visual that plots numeric distributions for multiple categories as stacked curves along a common continuous axis.
TRUVIZ INC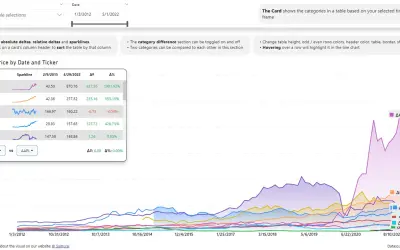
Power BI visual that compares categories over time, with YoY, MoM, YTD and MTD calculations, deltas and sparklines.
Datanauts
Power BI visual for comparing actuals against targets, with IBCS-certified bullet chart templates and comparison bands.
xViz LLC dba Lumel
Sign up for a Free Developer License and get 1 year access to this and 20+ ZoomCharts visuals for use in Power BI Desktop!
ZoomCharts«The Merged Bar Chart allows you to compare multiple categories in a single chart, as an alternative to the more complex scatterplot. Comparing categories is a common goal of data visualisations. In some cases comparing categories on a single measure (e.g. weight per shipment) is enough. This can be done with a …»