
Bullet Chart - xViz
Power BI visual for comparing actuals against targets, with IBCS-certified bullet chart templates and comparison bands.
xViz LLC dba LumelFreemium
Analyze process measurements in Power BI with XmR charts, control limits, moving ranges, and configurable signal rules.
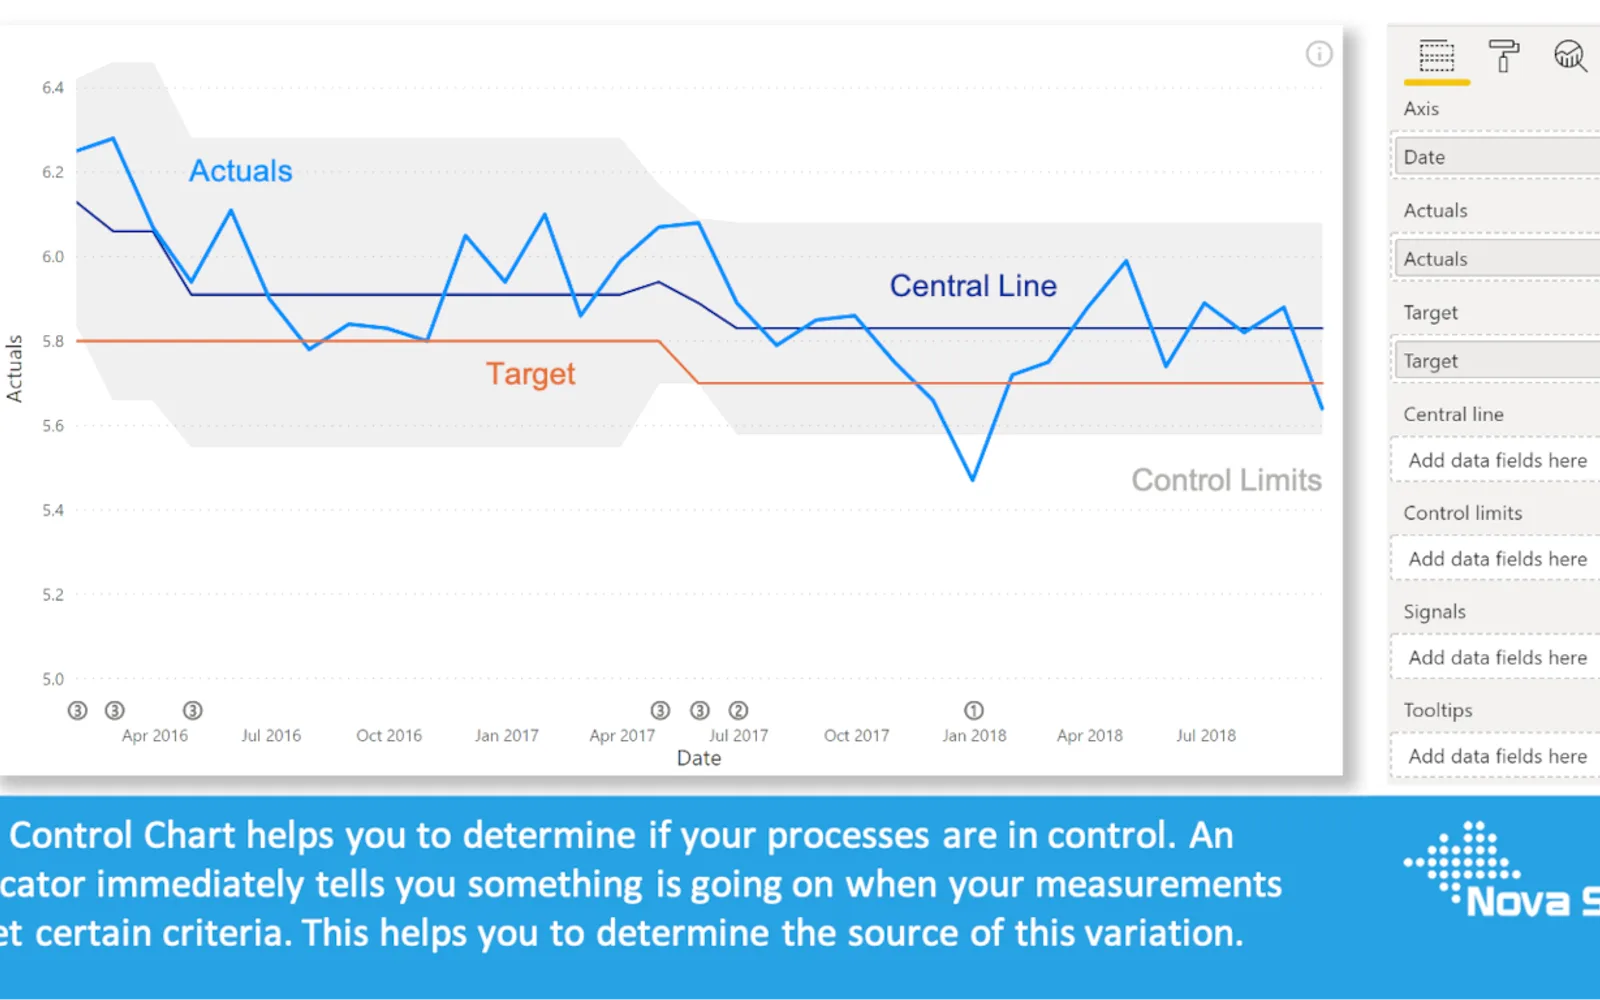
Displays measurements over time in an X-Chart with a calculated average and upper and lower control limits. A separate mR-Chart shows moving ranges, their average, and an upper control limit, and can be hidden. The visual detects signals using configurable Wheeler Rules or Nelson Rules, with options to recalculate the central line and control limits. It also provides standard and trending XmR modes, formatting, selection and highlighting, context-menu filtering, tooltips, and bookmarks.
Displays measurements over time in an X-Chart and a moving-range chart.
Calculates upper and lower control limits from the calculated average.
Detects signals using configurable Wheeler Rules or Nelson Rules.
Provides standard XmR and Trending XmR modes.
Formats lines, markers, and axes independently and supports theme settings.
Allows additional fields to be added to tooltips.
Supports bookmarks in Power BI.
Control Chart XmR and Bullet Chart - xViz are both freemium cloud listings. Control Chart XmR was updated in Jul 2026, while Bullet Chart - xViz was updated in Dec 2025. Progress Icon and Ultimate KPI Card are paid cloud listings, while Control Chart XmR is freemium. Ridgeline Plot by Powerviz is a free cloud listing, while Control Chart XmR is freemium.
| Name | Pricing | Deployment | Updated |
|---|---|---|---|
| this plugin | Freemium | Cloud | |
| Control Chart | Paid | Cloud | |
| Bullet Chart - xViz | Freemium | Cloud | |
| Progress Icon | Paid | Cloud | |
| Ultimate KPI Card | Paid | Cloud | |
| Ridgeline Plot by Powerviz | Free | Cloud |
657 plugins in Power BI · Analytics
Price distribution: 73 free, 108 freemium, 441 paid, 35 price not published
Power BI visual for comparing actuals against targets, with IBCS-certified bullet chart templates and comparison bands.
xViz LLC dba Lumel
Power BI custom visual that fills an SVG icon to show KPI progress toward a target instead of a plain number on a card.
NeenOpal Inc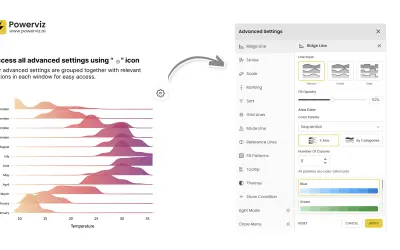
Custom Power BI visual that plots numeric distributions for multiple categories as stacked curves along a common continuous axis.
TRUVIZ INC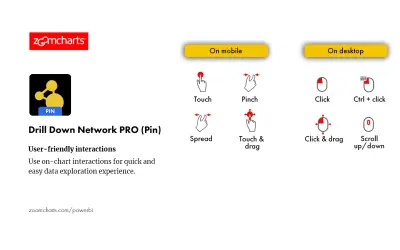
Drill Down Network PRO (Pin) by ZoomCharts renders interactive category-based network charts with drill-down support in Power BI.
ZoomCharts«The Control Chart XmR helps you to determine if your processes are in control. When your measurements meet certain criteria (see below), an indicator immediately tells you something is going on. This helps you to determine the source of this variation. The Control Chart XmR consists of two charts: The upper chart …»