
Bullet Chart - xViz
Power BI visual for comparing actuals against targets, with IBCS-certified bullet chart templates and comparison bands.
xViz LLC dba LumelFreemium
Displays KPI values, trends, targets, deviations, and refresh dates in a compact Power BI visual.
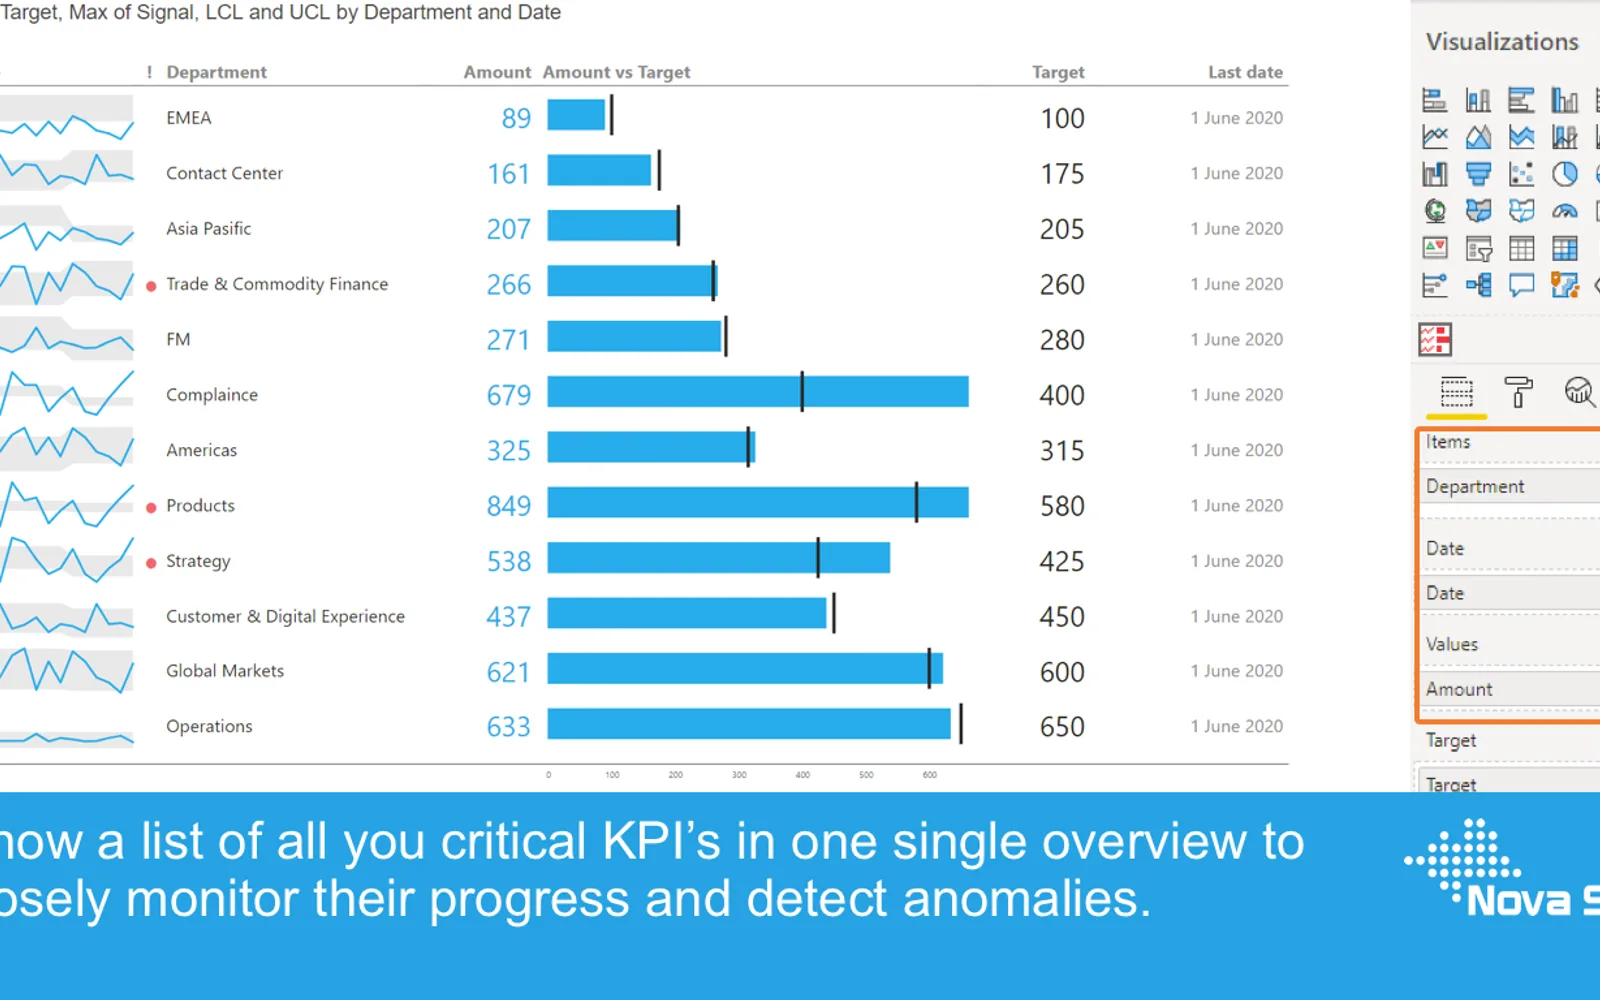
Displays multiple KPIs in one Power BI visual with contextual values, trends, targets, and refresh dates. Sparklines show historical trends and can include acceptable-result bands. Bar charts can show target lines, progress, qualitative ranges, and deviations from target values. Columns can be formatted individually, with support for selection, highlighting, context menus, tooltips, and bookmarks. The visual is free to try in Power BI Desktop, while production use and report sharing in Power BI Service require a license.
Displays multiple indicators with contextual values in one visual.
Shows historical KPI trends and can include acceptable-result bands.
Shows target lines, progress, and percentage deviations from target values.
Allows individual column formatting and basic color settings for sparklines and bars.
Supports selection and highlighting functions within the visual.
Provides context-menu options to include or exclude data points.
Supports additional tooltip fields, report tooltips, and bookmarks.
SMART KPI List is freemium and cloud-deployed, as is Bullet Chart - xViz; the other listed alternatives use paid or free pricing models and are also cloud-deployed. SMART KPI List was updated on Jul 2026, while the alternatives were updated between Dec 2025 and Jun 2026. The listing states support for KPI overviews, sparklines, target comparisons, formatting, selection, context menus, tooltips, and bookmarks; no equivalent capability details are provided for the alternatives.
| Name | Pricing | Deployment | Updated |
|---|---|---|---|
| this plugin | Freemium | Cloud | |
| Bullet Chart - xViz | Freemium | Cloud |
657 plugins in Power BI · Analytics
Price distribution: 73 free, 108 freemium, 441 paid, 35 price not published
Power BI visual for comparing actuals against targets, with IBCS-certified bullet chart templates and comparison bands.
xViz LLC dba Lumel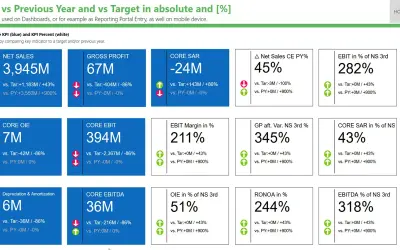
Power BI custom visual that displays a measure with variance to a target and/or previous year in absolute and percentage terms.
dataviz.boutique GmbH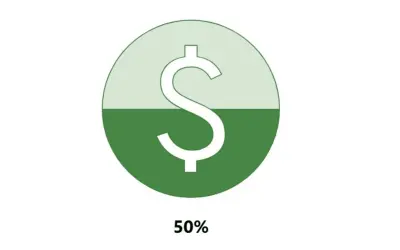
Power BI custom visual that fills an SVG icon to show KPI progress toward a target instead of a plain number on a card.
NeenOpal Inc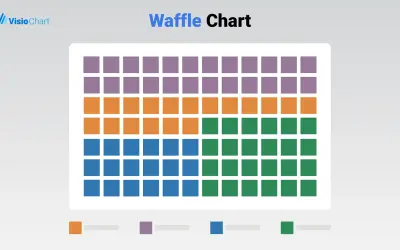
Waffle Chart Maker renders grid-based charts from numbers or percentages with sorting and cross-filtering for Microsoft Power BI.
VisioChart«One of the principal goals of any dashboard is to inform its users by creating an overview of multiple key performance indicators (KPIs). A good dashboard shows all relevant KPIs in a single screen, so we need a compact and effective way to display them. The SMART KPI List is created specifically for this purpose …»