
Gantt Chart
Gantt Chart is a project management visual for Microsoft Power BI that tracks schedules, milestones, and resource workloads.
ChartPadFree
Displays X and moving-range control charts in Power BI with automatic or manual recalculation.
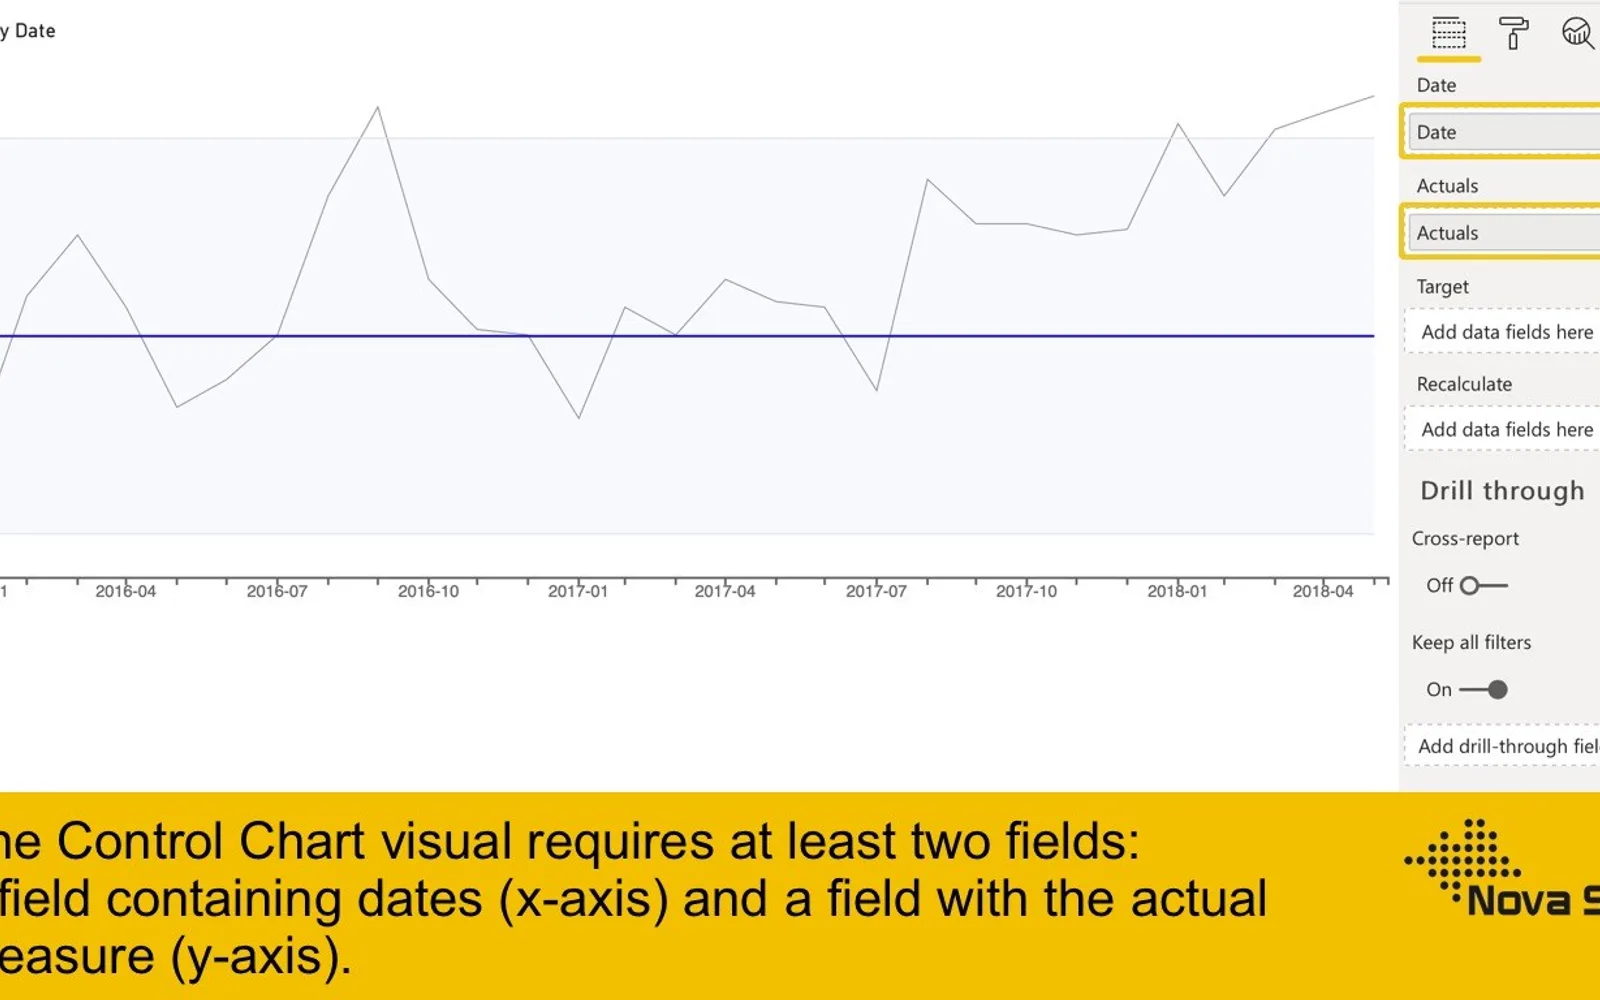
Displays measured data points over time in an X chart with an average center line and calculated upper and lower control limits. A moving-range chart displays the absolute difference between consecutive measurements, along with its average and upper control limit. The moving-range chart can be hidden. Automatic recalculation uses specified sequences of points, while a data value of 1 can trigger recalculation at a selected date.
Displays measured data points over time with an average center line and calculated upper and lower control limits.
Displays the absolute difference between consecutive measurements with an average and upper control limit.
Recalculates the charts when specified point sequences occur above or below the center line or near the control limits.
Recalculates the charts at the date where a data value is set to 1.
Allows the moving-range chart to be hidden.
2,531 plugins in Power BI · Analytics
Price distribution: 125 free, 147 freemium, 1,350 paid, 909 price not published
Gantt Chart is a project management visual for Microsoft Power BI that tracks schedules, milestones, and resource workloads.
ChartPad
Creates visualizations from diverse chart types, combines multiple charts on one canvas, and adds custom annotations and tooltips.
Akvelon
Creates financial and business reports in Power BI with automatic variance calculations, P&L logic, and drill-down (s5, s6).
Zebra BI
AI analysis app for Dynamics 365 Business Central that provides customer KPIs, churn probability, and customer grouping.
Data Courage«The ControlChart chart is actually two charts. The X is the data point being measured and mR the Moving Range which is the difference between consecutive data point measurements. The upper chart (X-Chart) displays the data-points over time (Actuals) together with a calculated average (Average - center-line (CL)). The …»