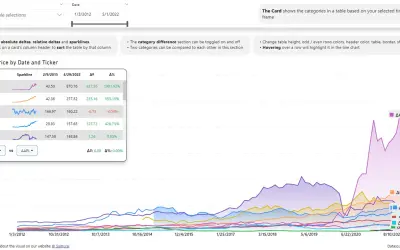
Multi Line Chart with Tooltips
Power BI visual that compares categories over time, with YoY, MoM, YTD and MTD calculations, deltas and sparklines.
DatanautsPaid
Compares two values in Power BI with paired markers, connecting lines, and an optional variance chart.
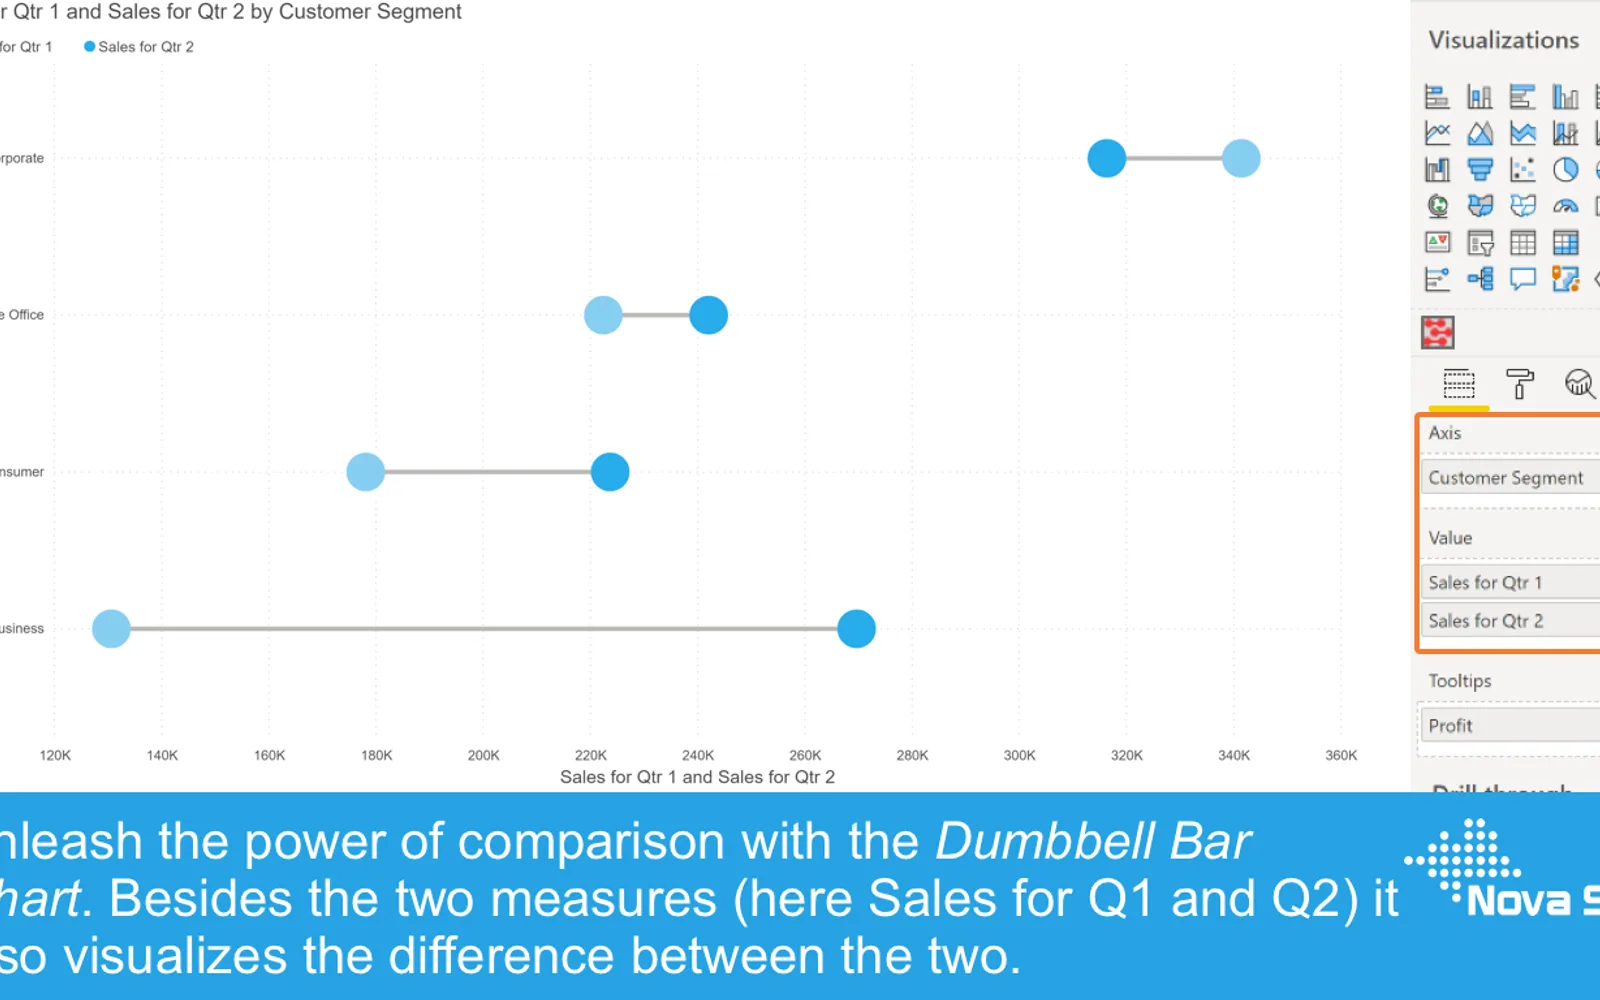
The visual displays two values with a marker for each value and a line connecting them. An optional variance chart shows the difference as an absolute amount or percentage. It also provides formatting controls, tooltips, bookmarks, data labels, conditional formatting, and reference lines.
Displays two values using markers connected by a line.
Shows the difference between two values as an absolute amount or percentage.
Allows colors, sizes, marker styles, line visibility, and marker fill to be configured.
Supports selection and partial highlighting functions within the Power BI chart.
Allows additional fields and another report page to be used in tooltips.
Changes the appearance of markers and lines based on data and rules.
Adds reference lines through the Analytics pane.
Dumbbell Bar Chart has a freemium pricing model and cloud deployment. Multi Line Chart with Tooltips and 100% Clustered Stacked Bar Chart (Standard) are paid, while Bullet Chart - xViz and Drill Down Combo Bar PRO (Filter) by ZoomCharts are freemium. Ridgeline Plot by Powerviz is free; all five alternatives use cloud deployment.
| Name | Pricing | Deployment | Updated |
|---|---|---|---|
| this plugin | Freemium | Cloud | |
| Multi Line Chart with Tooltips | Paid | Cloud | |
| 100% Clustered Stacked Bar Chart (Standard) | Not in catalog | ||
| Bullet Chart - xViz | Freemium | Cloud | |
| Drill Down Combo Bar PRO (Filter) by ZoomCharts | Freemium | Cloud | |
| Ridgeline Plot by Powerviz | Free | Cloud | |
657 plugins in Power BI · Analytics
Price distribution: 73 free, 108 freemium, 441 paid, 35 price not published
Power BI visual that compares categories over time, with YoY, MoM, YTD and MTD calculations, deltas and sparklines.
Datanauts
Power BI visual for comparing actuals against targets, with IBCS-certified bullet chart templates and comparison bands.
xViz LLC dba Lumel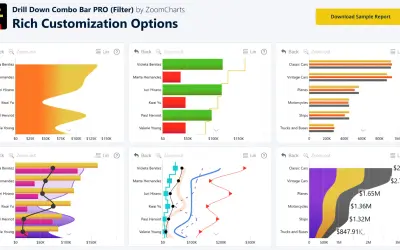
Sign up for a Free Developer License and get 1 year access to this and 20+ ZoomCharts visuals for use in Power BI Desktop!
ZoomCharts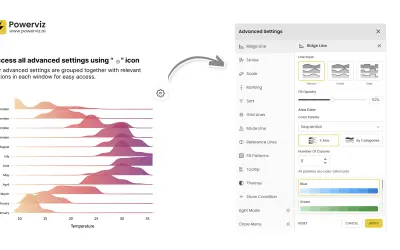
Custom Power BI visual that plots numeric distributions for multiple categories as stacked curves along a common continuous axis.
TRUVIZ INC«Data visualisations play a fundamental role in answering an important data question:”How does result A compare to result B?”. Typical examples of these questions are: • How does the sales of this month compare to the sales of last month? • What is the difference between the number of documents processed this year …»