ORXTRA - DXwand's Gen AI Agents Platform
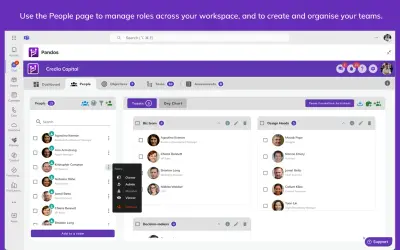
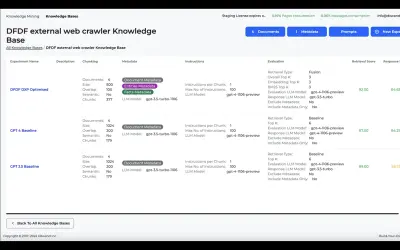
Build no-code conversational agents with RAG and multimodal support using ORXTRA - DXwand's Gen AI Agents Platform.
DXwandPaidCompare
2531 analytics apps for Microsoft 365
Build no-code conversational agents with RAG and multimodal support using ORXTRA - DXwand's Gen AI Agents Platform.
DXwand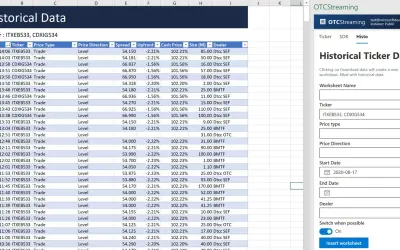
Excel add-in that provides credit derivatives reported trades, clearing volumes, and real-time streaming and historical data.
Hellebore Technologies
Ouriginal combines text-matching and writing style analysis to assess document authenticity within Microsoft Teams.
Haldor AB
OutKept Phishing Reporter lets employees report potential phishing mails and simulations via an Outlook add-in.
Outkept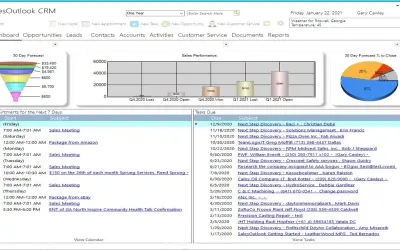
SalesOutlook CRM synchronizes data between Outlook and NetSuite, providing account, contact, lead, and opportunity management.
SalesOutlook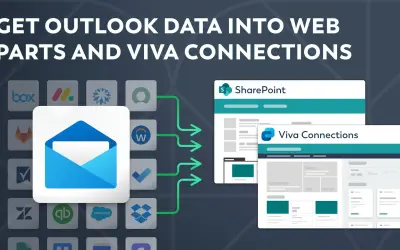
Embeds Outlook data in SharePoint via custom web parts, giving users a unified view of Microsoft 365 activities.
adenin TECHNOLOGIES Inc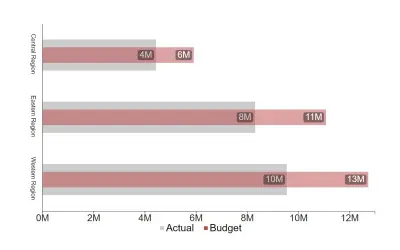
This horizontal bar chart is great for comparing two categories of data in a compact format by overlapping the bars.
Acorn Hill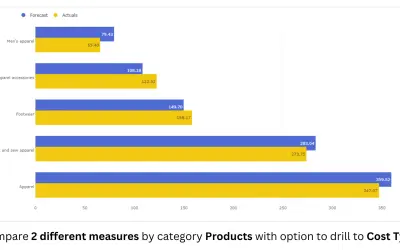
Overlapping Bar Chart (Pro) creates overlay bar variations such as thermometer and lipstick charts for Power BI reports.
PBIVizEdit.com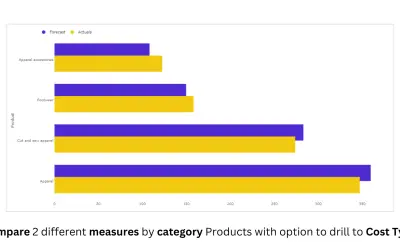
Overlapping Bar (Standard) creates overlay bar chart variations such as thermometer and lipstick charts for Microsoft Power BI.
PBIVizEdit.com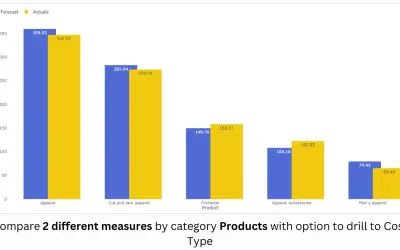
Power BI custom visual from PBIVizEdit for creating thermometer, lipstick, and patterned overlay column charts.
PBIVizEdit.com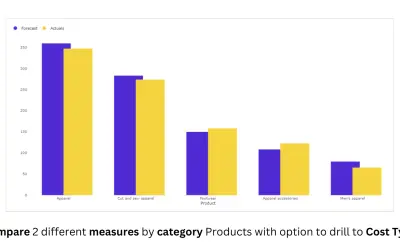
Overlapping Column (Standard) creates overlay column chart variations, including thermometer and lipstick styles, for Power BI.
PBIVizEdit.com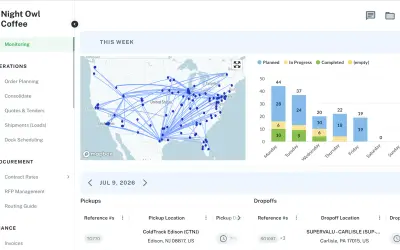
Owlery automates rate shopping, load building, tracking, and invoice auditing for Business Central and Dynamics 365.
Owlery, Inc
P.AI App lets users query, summarize, and analyze enterprise relational database data directly within Microsoft Teams Chat.
Polestar-MarketPlace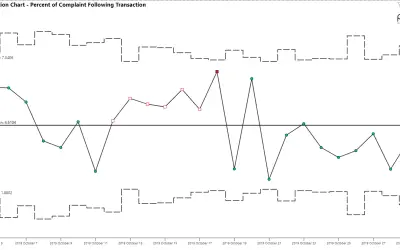
P-Chart plots proportions of nonconforming items across varying subgroup sizes within PI VIZpack™ for Power BI®.
PQ Systems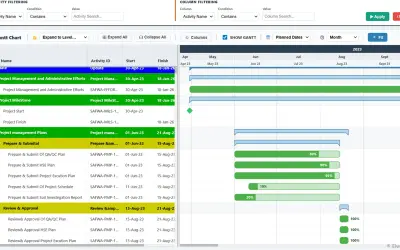
Visualizes project timelines and task hierarchies from Primavera P6 schedule data as an interactive Gantt chart in Power BI.
4Cs Global LLC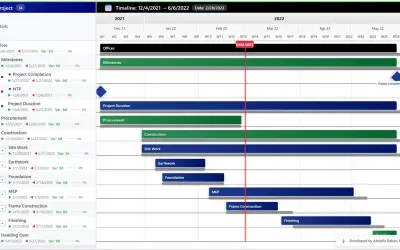
A Power BI custom visual providing five Oracle Primavera P6-style Gantt chart layouts for project management reporting.
Abdalla Dabes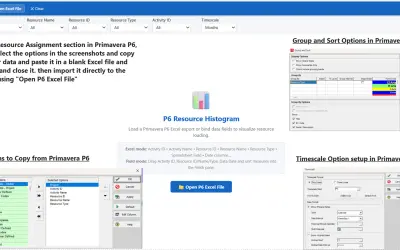
Power BI custom visual that turns Primavera P6 Excel exports or live Power BI fields into interactive resource loading charts.
Abdalla Dabes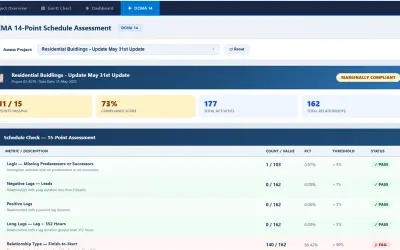
Reads Primavera P6 XER files directly inside Power BI without a connector, gateway, or file conversion for project controls teams.
Abdalla Dabes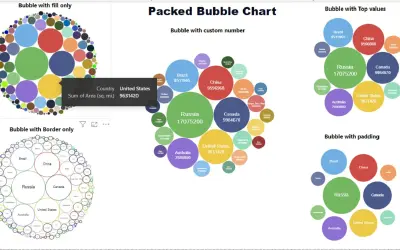
PackedBubbleChart displays data as sized, categorized bubbles with shape and tooltip options for Power BI custom visuals.
Qatar Financial Centre Regulatory Authority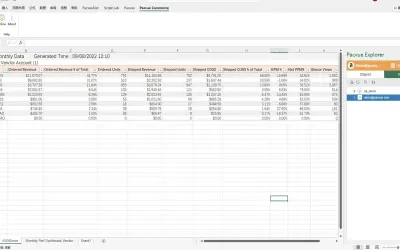
Brings Amazon ad data into Excel for performance reporting and bulk updates to Amazon and Walmart eCommerce data.
Pacvue
Padlet provides boards and sandboxes for collecting, organizing, and presenting content within Microsoft Teams.
Wallwisher Inc
Microsoft Office add-in that gathers review comments and approvals on Word, Excel, and PowerPoint files in one place.
PageProof