
Gantt Chart
Gantt Chart is a project management visual for Microsoft Power BI that tracks schedules, milestones, and resource workloads.
ChartPadFree
Charts Primavera P6 resource loads in Power BI using exported spreadsheet data or connected fields.
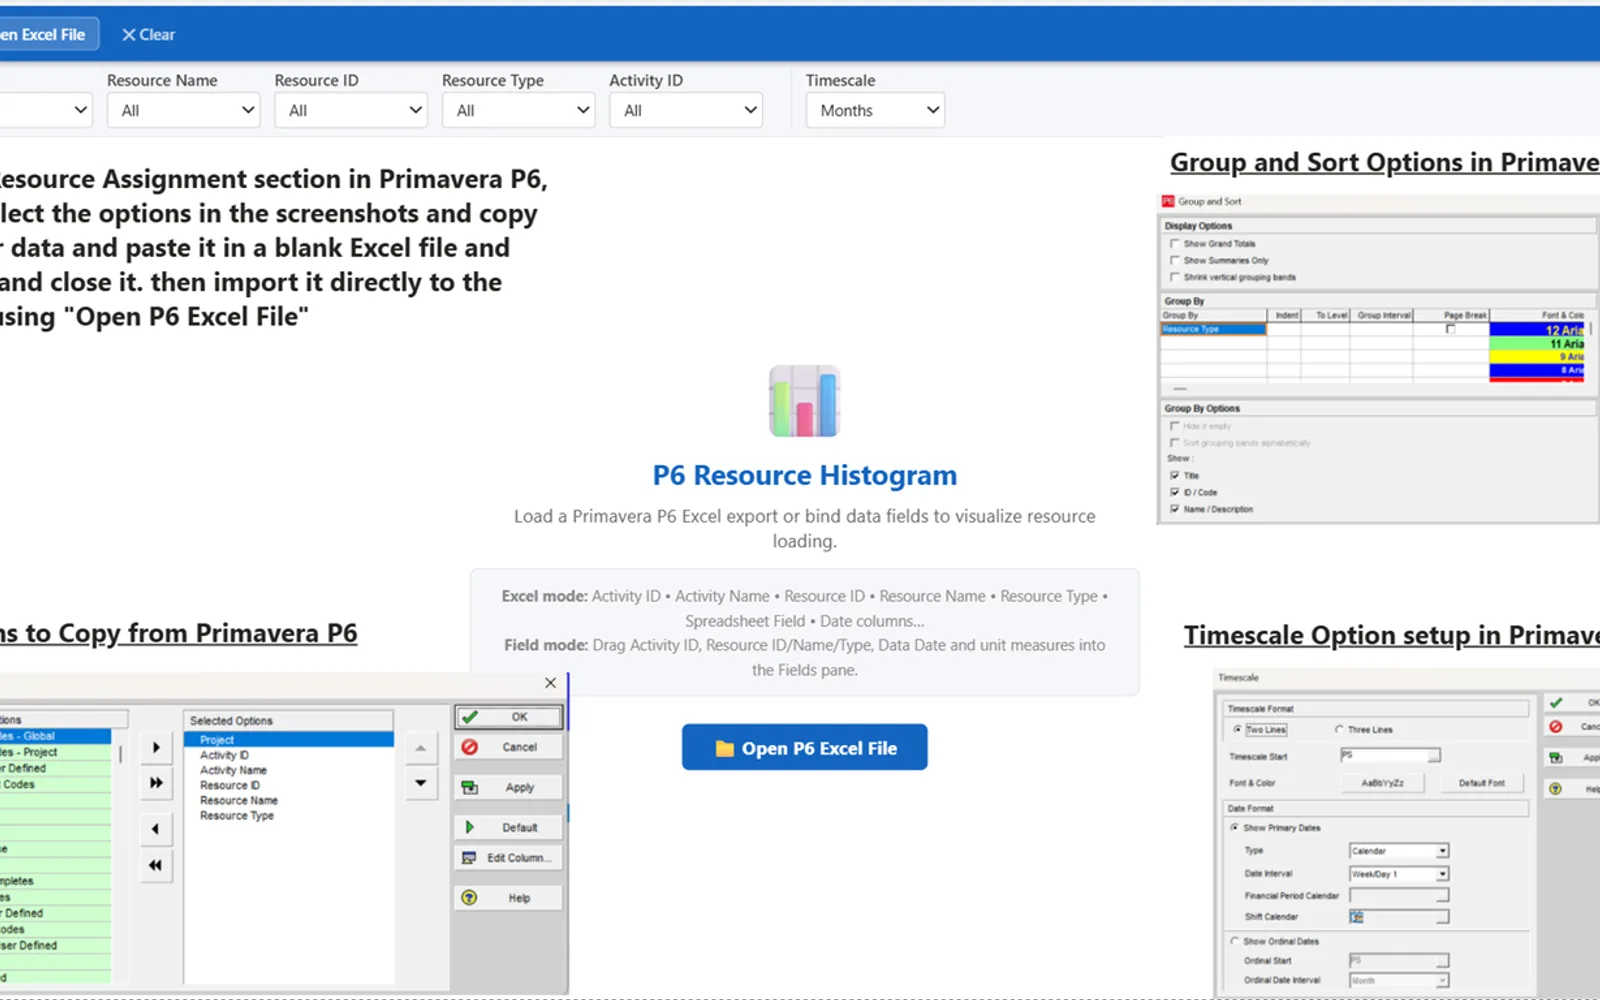
This Power BI visual charts four resource measures across selectable time periods. Data may be loaded from a Primavera P6 spreadsheet export or supplied through Power BI fields. Filters cover projects, resource types, resource names, resource IDs, and activity IDs, and remain selected when moving between pages. The visual also provides a data-date marker, stacked or grouped bars, configurable display settings, and Windows High Contrast support.
Reads resource data from a Primavera P6 Excel export.
Accepts data through fields connected in Power BI.
Shows budgeted, actual, early-remaining, and late-remaining units by time period.
Provides filters for projects, resource types, resource names, resource IDs, and activity IDs.
Groups chart data by days, weeks, months, quarters, or years.
Offers stacked and grouped presentations for the bars.
Allows changes to colors, titles, legends, and the data-date marker.
Supports Windows High Contrast settings.
Primavera P6 project controls professionals.
p6-resource-histogram has a free pricing model, while Histogram Chart (Pro) uses a freemium model. Both listings are deployed in the cloud. The listing for p6-resource-histogram shows an update date of May 2026, while Histogram Chart (Pro) shows Dec 2025.
| Name | Pricing | Deployment | Updated |
|---|---|---|---|
| this plugin | Free | Cloud | |
| Histogram Chart (Pro) | Not in catalog | ||
1,008 plugins in Power BI · Analytics
Price distribution: 75 free, 112 freemium, 520 paid, 301 price not published
Gantt Chart is a project management visual for Microsoft Power BI that tracks schedules, milestones, and resource workloads.
ChartPad
Creates visualizations from diverse chart types, combines multiple charts on one canvas, and adds custom annotations and tooltips.
Akvelon
Creates financial and business reports in Power BI with automatic variance calculations, P&L logic, and drill-down (s5, s6).
Zebra BI
AI analysis app for Dynamics 365 Business Central that provides customer KPIs, churn probability, and customer grouping.
Data Courage«The P6 Resource Histogram is a Power BI custom visual purpose-built for Primavera P6 project controls professionals. It transforms raw P6 Excel exports into dynamic, interactive resource loading charts — displaying Budgeted Units, Actual Units, Remaining Early Units, and Remaining Late Units side by side across Days …»