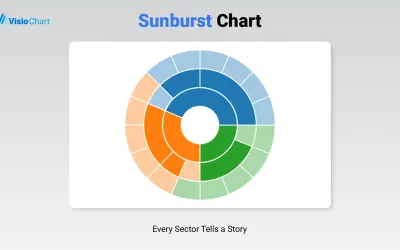
Sunburst Chart
Displays up to five levels of hierarchical data as proportional segments across concentric rings in Power BI reports.
VisioChartFreemium
Horizontal bar chart for comparing two data categories in Power BI by overlapping bars.
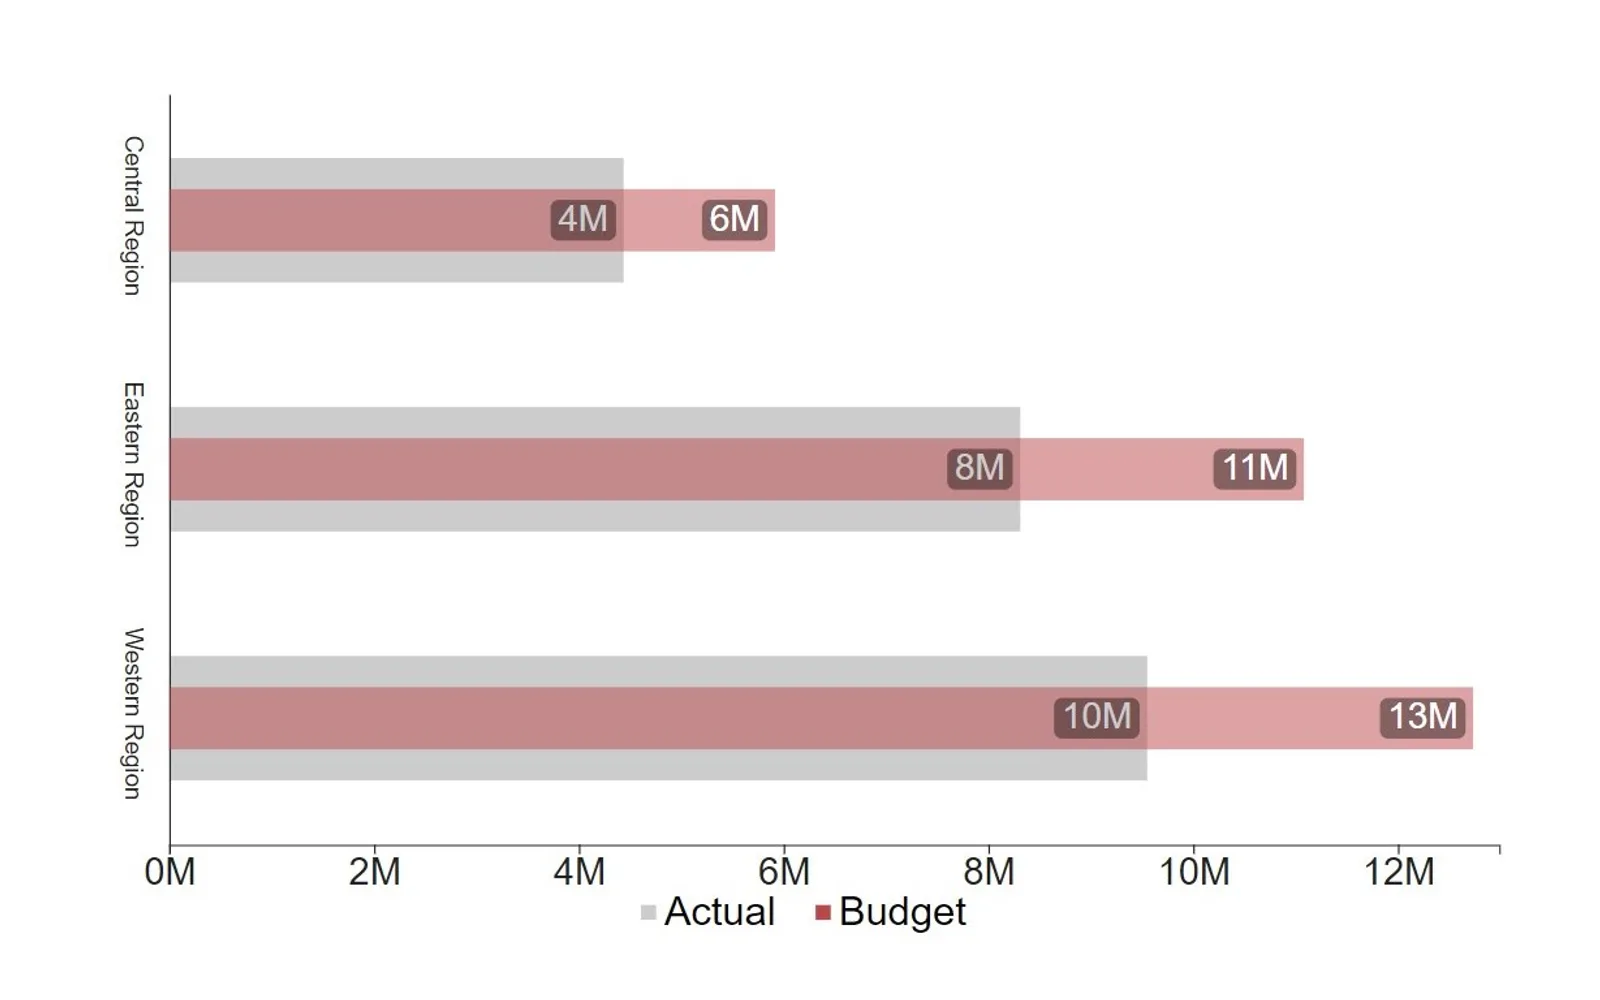
Creates a horizontal bar chart that compares two categories of data by overlapping the bars. It can compare actual results with target or goal data, including actual financial results with budgeted results. Bar width, transparency, axes, and labels can be customized.
Compares two categories of data by displaying overlapping horizontal bars.
Allows customization of bar width.
Allows customization of bar transparency.
Allows customization of the chart axis.
Allows customization of chart labels.
Overlapping Bar Chart is a paid, cloud-deployed listing updated on Oct 2024. Sunburst Chart and Bullet Chart - xViz are freemium and cloud-deployed, with both listed as updated in Dec 2025. 100% Clustered Stacked Bar Chart (Standard) and Progress Icon are also paid and cloud-deployed; their listed update dates are Apr 2024 and May 2026. Multi Line Chart with Tooltips is paid and cloud-deployed, with a listed update date of Jan 2025.
| Name | Pricing | Deployment | Updated |
|---|---|---|---|
| this plugin | Paid | Cloud | |
| Sunburst Chart | Freemium | Cloud | |
| Bullet Chart - xViz | Freemium | Cloud | |
| 100% Clustered Stacked Bar Chart (Standard) | Not in catalog | ||
| Progress Icon | Paid | Cloud | |
| Multi Line Chart with Tooltips | Paid | Cloud | |
657 plugins in Power BI · Analytics
Price distribution: 73 free, 108 freemium, 441 paid, 35 price not published
Displays up to five levels of hierarchical data as proportional segments across concentric rings in Power BI reports.
VisioChart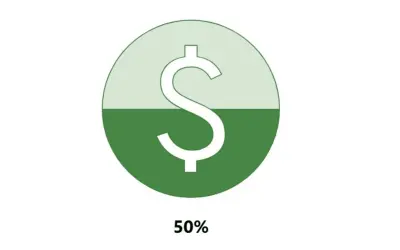
Power BI custom visual that fills an SVG icon to show KPI progress toward a target instead of a plain number on a card.
NeenOpal Inc
Power BI visual for comparing actuals against targets, with IBCS-certified bullet chart templates and comparison bands.
xViz LLC dba Lumel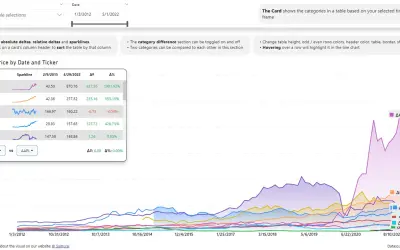
Power BI visual that compares categories over time, with YoY, MoM, YTD and MTD calculations, deltas and sparklines.
Datanauts«This horizontal bar chart is great for comparing two categories of data in a compact format by overlapping the bars. A common use for this visual is comparing a series of actual data to target/goal data, such as actual financial results to budgeted financial results. Its clean simplicity lends itself to a wide range …»