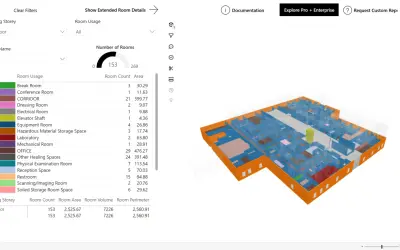
Open IFC Viewer
Power BI visual that parses IFC models locally, keeping BIM data private and secure with no uploads to external servers.
Flinker GmbHFreemiumCompare
2531 analytics apps for Microsoft 365
Power BI visual that parses IFC models locally, keeping BIM data private and secure with no uploads to external servers.
Flinker GmbH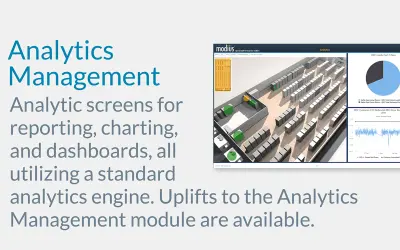
OpenData manages performance of mission-critical infrastructure for Modius by unifying device data, analytics, and dashboards.
Modius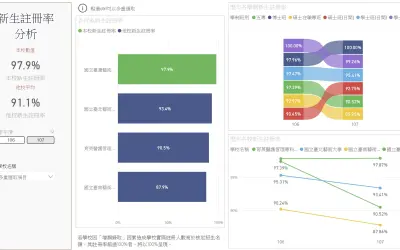
Analyzes Ministry of Education open data on enrollment, retirement, and funds, providing visual comparisons for schools.
智域國際股份有限公司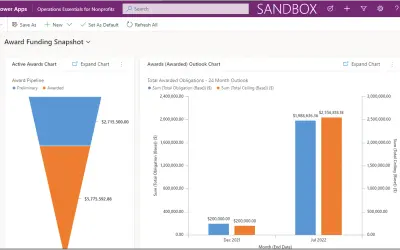
Manages funds, awards, projects, and workforce for nonprofits; deploys to an existing Dynamics 365 Sales environment.
Simple Actions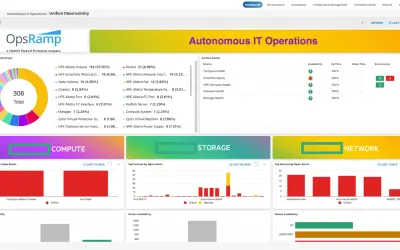
Provides unified observability, AI-powered analytics, and intelligent automation for hybrid IT environments in HPE OpsRamp.
OpsRamp, Inc.
Hospitality app and portal for team members and management covering HR, scheduling, payroll, tips, and daily reporting.
OPSYTE ONLINE LTD
Optelos Enterprise Asset Advisor combines visual data management, digital twins, and AI computer vision for Azure EAM strategies.
Optelos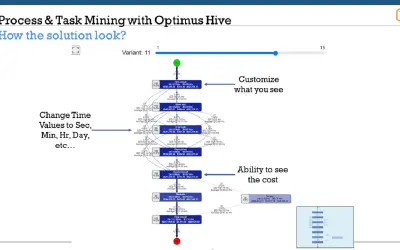
Converts activity records into graphical process flows for Optimus Hive to display variant statistics and path details.
Ai Transitioning LLC
Excel Add-in for OrbusInfinity that imports objects and relationships from Excel datasheets into your repository.
Orbus Software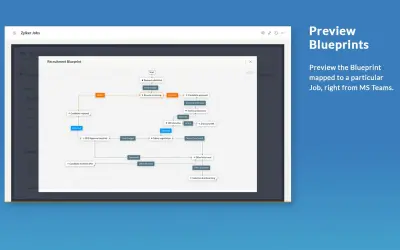
Orchestly automates, orchestrates, and optimizes routine business workflows for medium and enterprise organizations.
Zoho Corporation Private Limited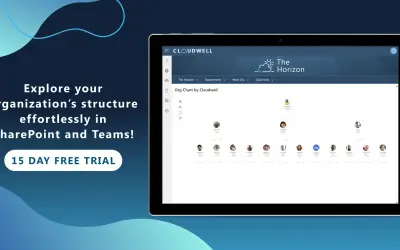
Org Chart by Cloudwell displays your organization as profile cards you can flip for details in SharePoint and Microsoft Teams.
Cloudwell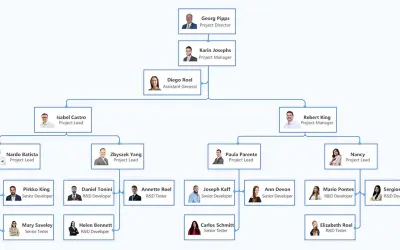
Visualizes company organizational structures and family genealogy as trees with automatic layout from parent-child IDs.
sharewinfohk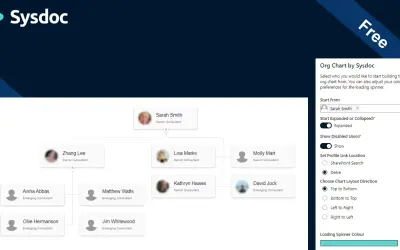
Org Chart by Sysdoc is a web part that displays organizational hierarchy data on SharePoint sites using PnP Graph.
The Sysdoc Group Limited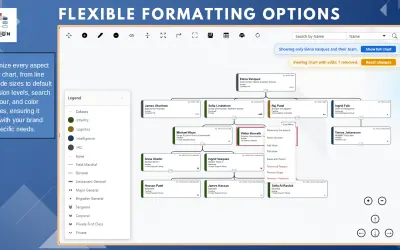
WorkforceVision Org Chart Drag & Drop enables drag-and-drop org design, scenario planning, and matrix reporting in Power BI.
WorkforceVision LTD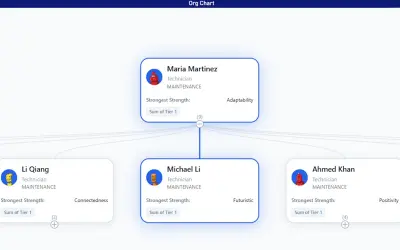
A custom visual for Power BI that transforms hierarchical employee data into an interactive organization chart with search.
Hoang Nguyen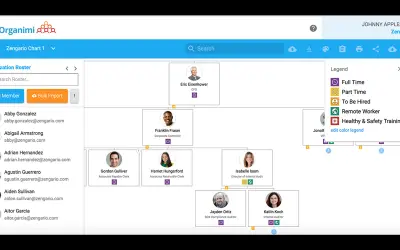
Organimi is purpose-built org chart software for creating, sharing, and printing organizational charts for your workplace.
Organimi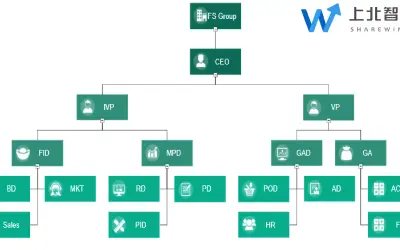
Generates dynamic, real-time organization charts for Sharewinfo, with one-click automatic layout and configurable styles.
北京上北智信科技有限公司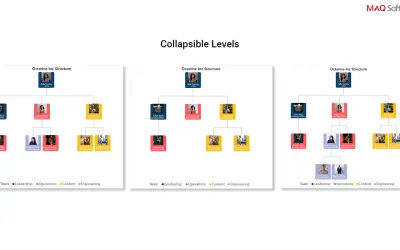
Organization Chart by MAQ Software depicts relationships and ranks in a structured tree format with images to identify personnel.
MAQ LLC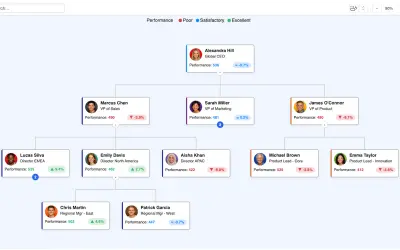
Organizational Chart visual for Microsoft 365 that maps teams, hierarchies, processes, and supply chains with KPI tracking.
ChartPad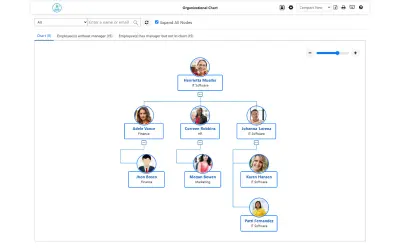
Displays company hierarchy and employee details pulled from SharePoint user profiles as a flowchart within SharePoint.
Beyond Technologies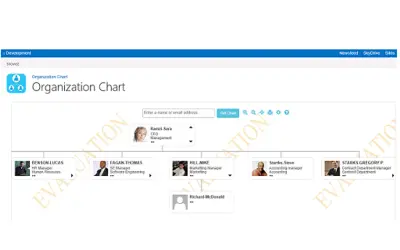
Creates organizational charts in SharePoint 2013 or Office 365 that users can navigate to find contact and hierarchy details.
AASoftech Inc.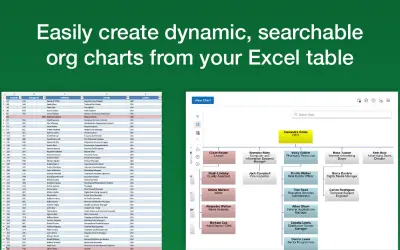
Generates organization charts in Microsoft Excel, with charts updating automatically as spreadsheet data changes.
TeamImprover.Com Ltd