
Power Plot Visual by Akvelon
Creates visualizations from diverse chart types, combines multiple charts on one canvas, and adds custom annotations and tooltips.
AkvelonFreemium
Displays data as packed bubbles with configurable shapes, sizes, categories, labels, tooltips, and drill-through.
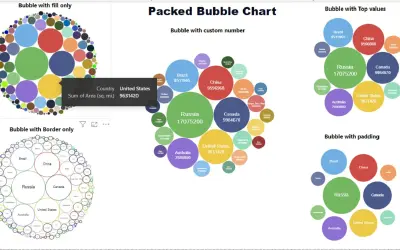
Displays values by size and category in a packed bubble chart. It supports circles, squares, triangles, and diamonds. Users can set the number of bubbles, highlight top or bottom values, and format labels or values. Custom tooltips and drill-through options support interactive data exploration.
Displays data values by bubble size and category.
Supports circles, squares, triangles, and diamonds.
Allows customization of the number of bubbles displayed.
Highlights bubbles with top or bottom values.
Applies formatting to labels or values.
Provides custom tooltips and drill-through options.
2,531 plugins in Analytics
Price distribution: 125 free, 147 freemium, 1,350 paid, 909 price not published
Creates visualizations from diverse chart types, combines multiple charts on one canvas, and adds custom annotations and tooltips.
Akvelon
Creates financial and business reports in Power BI with automatic variance calculations, P&L logic, and drill-down (s5, s6).
Zebra BI
COSMO Text Module provides extended text management with a WYSIWYG editor for Microsoft Dynamics 365 Business Central.
COSMO CONSULT
Discover the why behind your data.
Data Courage«Our custom visual is the perfect tool for displaying your data in a visually stunning and powerful way. Using a packed bubble chart, you can showcase your data in a unique and engaging way, with the ability to display values as size and category. Our visual also includes a variety of shapes, including circles …»