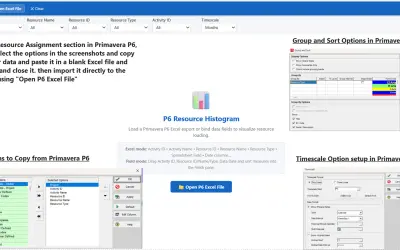
p6-resource-histogram
Power BI custom visual that turns Primavera P6 Excel exports or live Power BI fields into interactive resource loading charts.
Abdalla DabesFree
Visualizes Primavera P6 schedules and task hierarchies in Power BI.
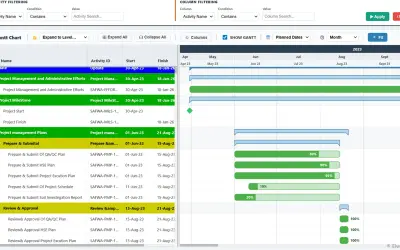
Displays project schedules and task hierarchies in Power BI using data exported from Primavera P6. It supports customizable bar colors, milestone indicators, and interactive tooltips. Setup requires placing schedule data in Excel, adding a sequential Sort column, and importing the file into Power BI.
Displays project schedules in Power BI.
Shows project task hierarchies.
Uses data exported from Primavera P6.
Allows project schedule bars to use customizable colors.
Displays milestone indicators on project schedules.
Provides interactive tooltips for schedule data.
Project managers and project stakeholders.
1,008 plugins in Power BI · Analytics
Price distribution: 75 free, 112 freemium, 520 paid, 301 price not published
Power BI custom visual that turns Primavera P6 Excel exports or live Power BI fields into interactive resource loading charts.
Abdalla Dabes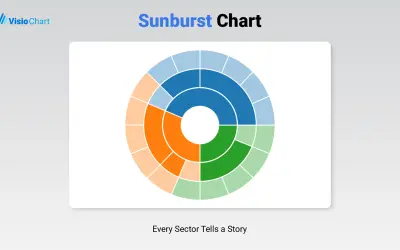
Displays up to five levels of hierarchical data as proportional segments across concentric rings in Power BI reports.
VisioChart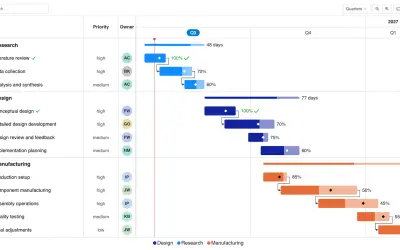
Gantt Chart is a project management visual for Microsoft Power BI that tracks schedules, milestones, and resource workloads.
ChartPad
Creates visualizations from diverse chart types, combines multiple charts on one canvas, and adds custom annotations and tooltips.
Akvelon«P6 Gantt Chart is a powerful and flexible project scheduling visual for Power BI. It is specifically designed to handle complex data from project management tools like Primavera P6, allowing you to visualize project timelines with high accuracy. Key Features Seamlessly visualize project schedules and task hierarchies …»