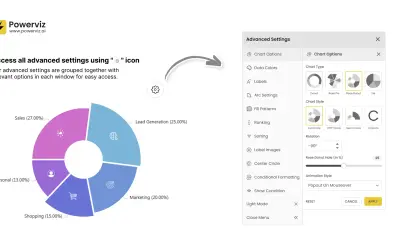
Rose Donut Pie Chart by Powerviz
Rose Donut Pie Chart by Powerviz displays part-to-whole relationships using rose, donut, and pie chart types for Power BI.
TRUVIZ INCFreeCompare
125 analytics apps for Microsoft 365
Rose Donut Pie Chart by Powerviz displays part-to-whole relationships using rose, donut, and pie chart types for Power BI.
TRUVIZ INC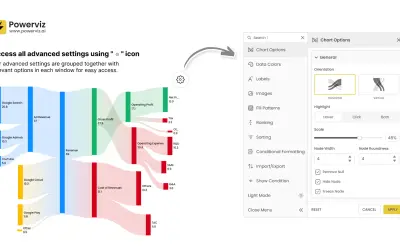
Sankey Chart by Powerviz provides multi-level vertical and horizontal charts with ranking, sorting, and conditional formatting.
TRUVIZ INC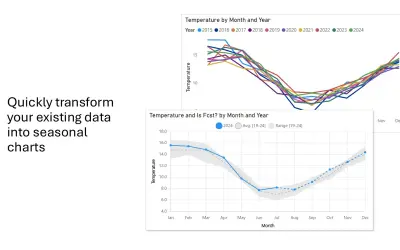
Seasonal Chart is a Power BI visual that displays historical ranges and recurring patterns in time-series data for analysis.
Vector Forge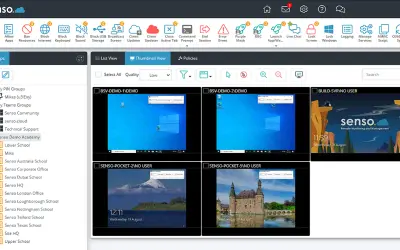
Monitors Microsoft Teams chat and images to safeguard staff and students, with alerts for visual threats and wellbeing (SEL).
Renato Software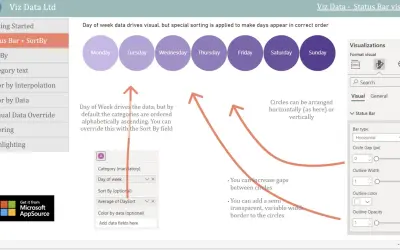
Status Bar visualizes and filters category data as customizable circles within Power BI reports using dynamic sizing and color.
Viz Data Ltd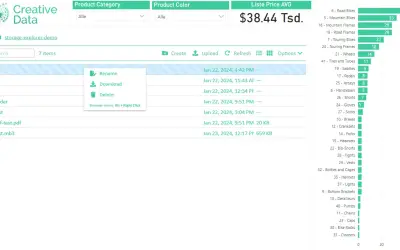
Storage Explorer connects to cloud storage via REST APIs to provide native file browsing within Power BI.
Creative Data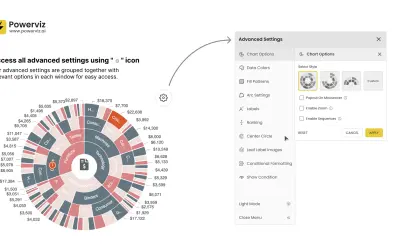
Sunburst by Powerviz displays hierarchical data using concentric circles with conditional formatting and drill-down features.
TRUVIZ INC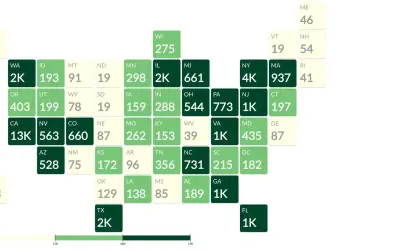
Build tile grid maps and custom heatmaps in Supermetrics Charts to compare metrics across regions regardless of geographic area.
Supermetrics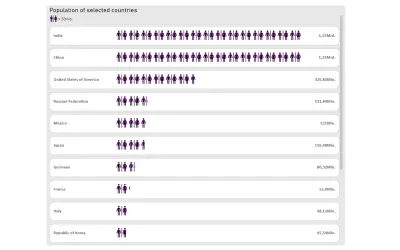
Symbol Chart creates infographic-style visuals connecting data to real-world objects using symbols and icons in Power BI.
relevantVisuals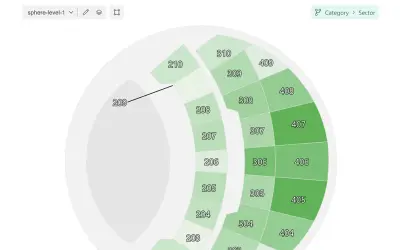
Custom Power BI visual that layers interactive data over images, shapes, and geographical maps to add context to reports.
OKVIZ Corp.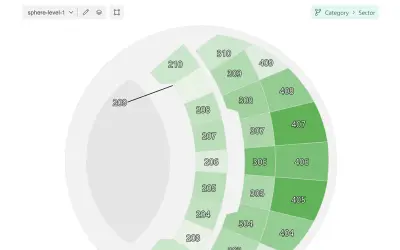
Microsoft-certified Power BI visual for map-based visualizations with multi-level navigation and local map loading.
OKVIZ Corp.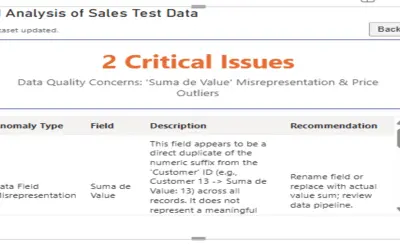
A Power BI visual that uses artificial intelligence to analyze table data, detect anomalies, and identify potential errors.
Zynexia Angel Pacheco
TeamViewer Frontline delivers AR workflows on wearable and mobile devices for industrial processes along the value chain.
TeamViewer Germany GmbH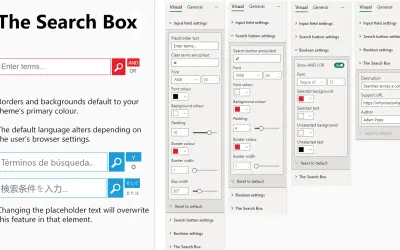
A Power BI search box that filters reports in real time and supports quoted phrases, OR matching, and multi-column search.
Adam Pope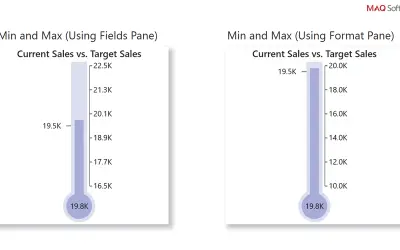
A Power BI custom visual that displays progress against goals on a temperature scale showing actuals, thresholds, and targets.
MAQ LLC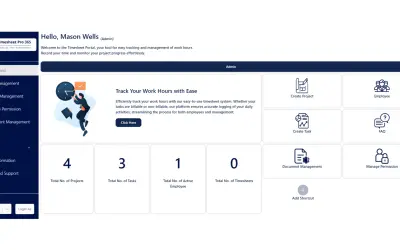
Timesheet Pro 365 provides time tracking, compliance rules, and reporting for SharePoint and Microsoft 365 environments.
Ignatiuz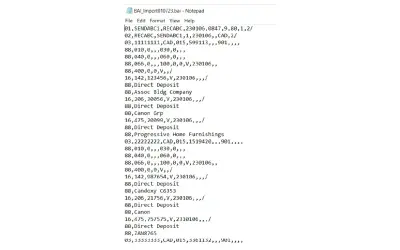
Automates cash application and bank reconciliation using BAI statements for Dynamics 365 Business Central Essentials and Premium.
NIC Systems Inc.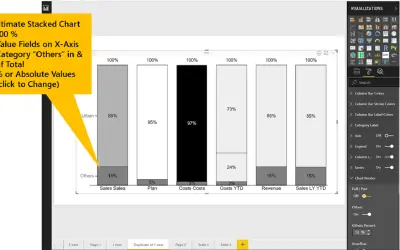
Ultimate Stacked Chart is a Power BI visual that supports IBCS, groups legend elements, and highlights deviations between bars.
Dataviz.Boutique GmbH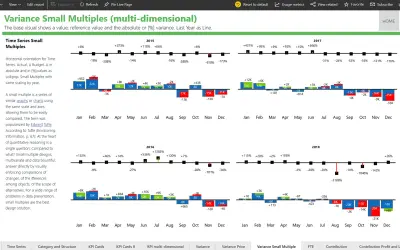
A Power BI custom visual that displays base, absolute variance, and percent variance charts with small multiples support.
DataViz.Boutique GmbH
Uptale lets enterprises build, distribute, and measure interactive 360° VR training modules with learner analytics dashboards.
Uptale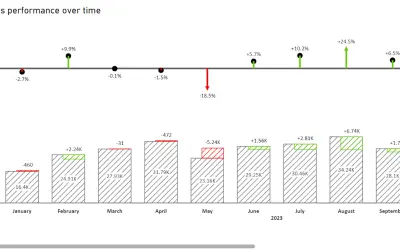
Variance Chart displays differences between two measures, e.g. actual vs. target, as color-coded column or bar charts per IBCS®.
relevantVisuals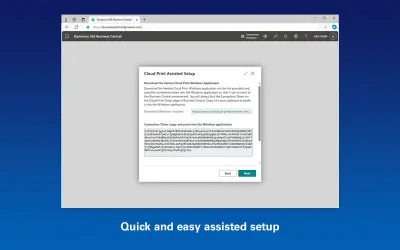
Extension that makes local printers, including label and office printers, available in Microsoft Dynamics 365 Business Central.
Ventoo