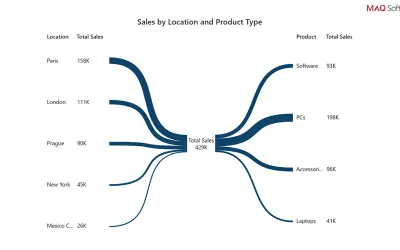
Bowtie Chart by MAQ Software
Power BI custom visual that renders data as a bowtie chart, using branch thickness to show each category's relative weight.
MAQ LLCPaid
Generate Power BI seasonality charts showing historical ranges, averages, and current-period performance.
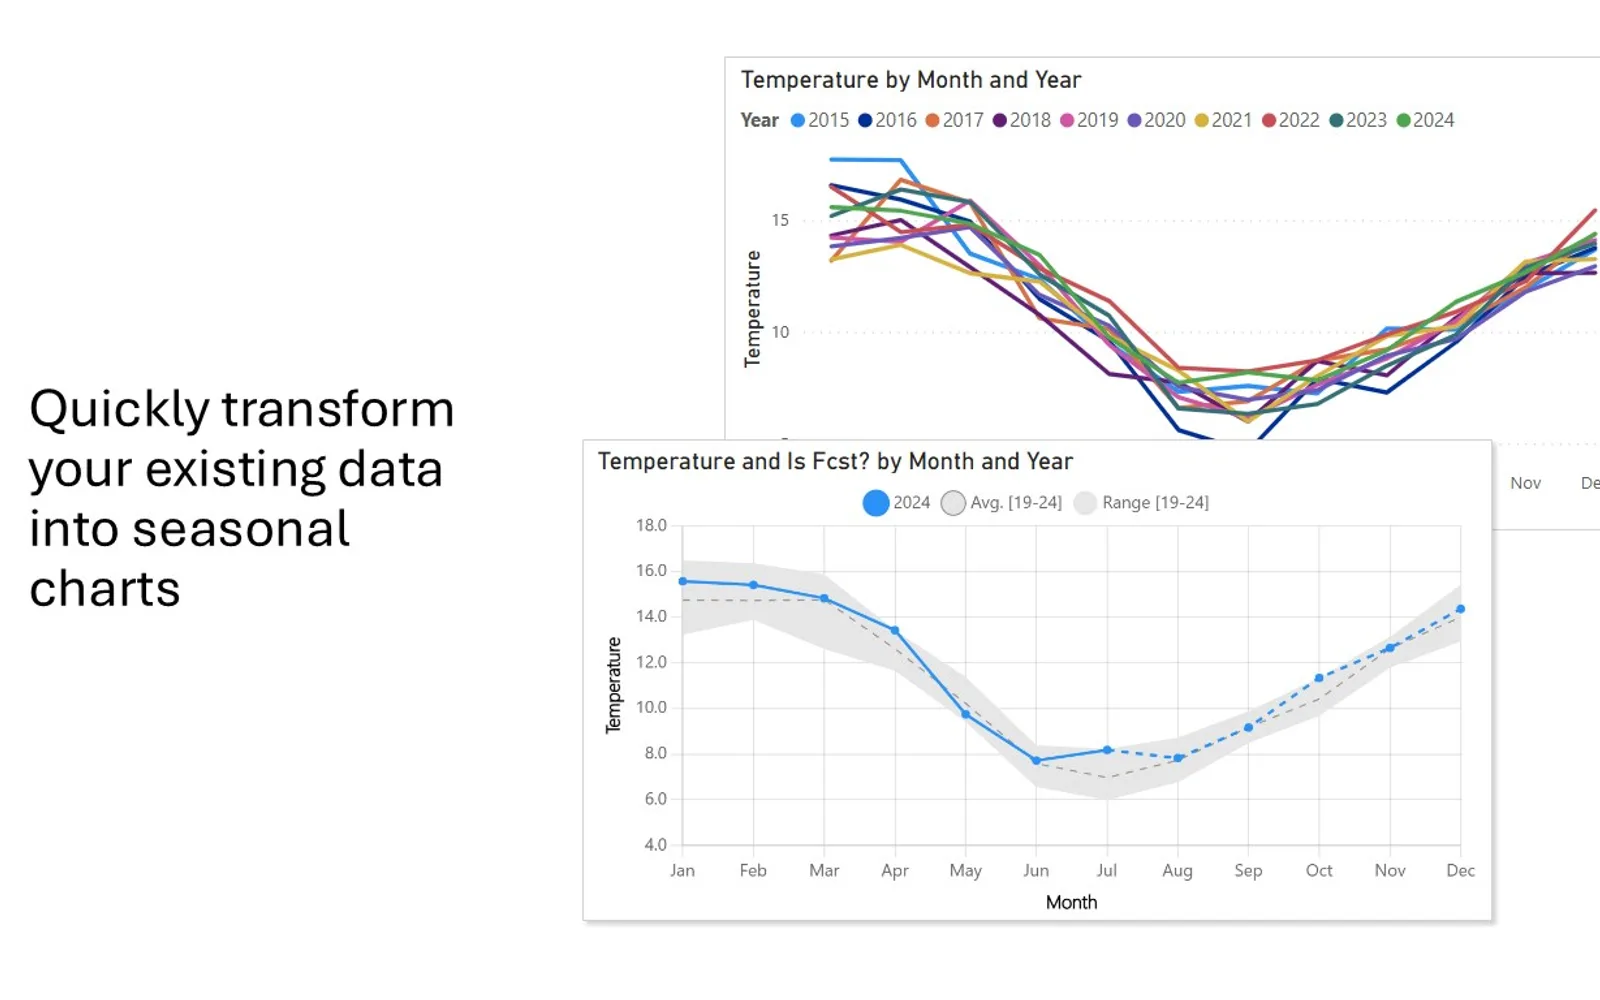
Displays seasonal patterns in Power BI time-series data across daily, weekly, or monthly periods. The visual calculates historical minimum, maximum, and average bands. It compares current-period values with historical patterns and supports color and formatting changes.
Shows minimum and maximum values for each selected time period.
Displays average values alongside historical ranges.
Compares current-period values with historical seasonal patterns.
Supports daily, weekly, and monthly views.
Allows colors and formatting to be customized.
Business analysts, data scientists, and decision-makers.
Seasonal Chart is free, cloud-deployed, and was updated on Dec 2025. Bowtie Chart by MAQ Software is paid and cloud-deployed, with an update date of May 2026. Histogram Chart (Pro), Sunburst Chart, and Waffle Chart Maker are freemium or free cloud-deployed alternatives updated in Dec 2025, while Ridgeline Plot by Powerviz is free, cloud-deployed, and updated in Jul 2026.
| Name | Pricing | Deployment | Updated |
|---|---|---|---|
| this plugin | Free | Cloud | |
| Bowtie Chart by MAQ Software | Paid | Cloud | |
| Histogram Chart (Pro) | Not in catalog | ||
| Sunburst Chart | Freemium | Cloud | |
| Waffle Chart Maker | Free | Cloud | |
| Ridgeline Plot by Powerviz | Free | Cloud | |
657 plugins in Power BI · Analytics
Price distribution: 73 free, 108 freemium, 441 paid, 35 price not published
Power BI custom visual that renders data as a bowtie chart, using branch thickness to show each category's relative weight.
MAQ LLC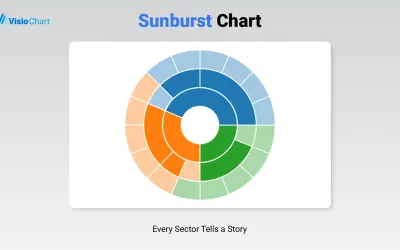
Displays up to five levels of hierarchical data as proportional segments across concentric rings in Power BI reports.
VisioChart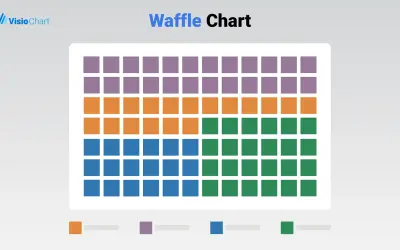
Waffle Chart Maker renders grid-based charts from numbers or percentages with sorting and cross-filtering for Microsoft Power BI.
VisioChart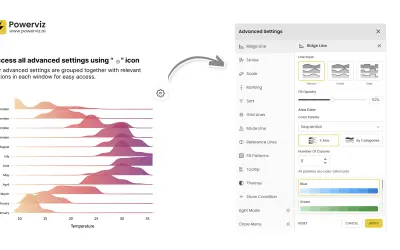
Custom Power BI visual that plots numeric distributions for multiple categories as stacked curves along a common continuous axis.
TRUVIZ INC«This custom Power BI visual specializes in generating clear, intuitive seasonality charts that display historical ranges and patterns in your time-series data. Perfect for analyzing recurring patterns across years, this visual shows: * **Historical Ranges:** Instantly view minimum and maximum boundaries for each time …»