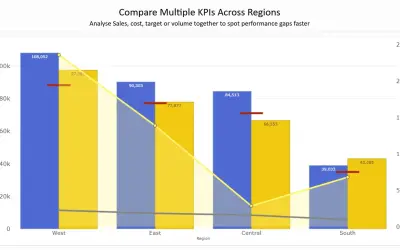
Dual Y-Axis Combo Chart (Pro) for Power BI
Combines column, line, area, and scatter charts on dual Y-axes to compare up to 8 metrics in a single Power BI visual.
PBIVizEdit.comFreemium
Creates icon-based infographic charts in Power BI using predefined or custom symbols.
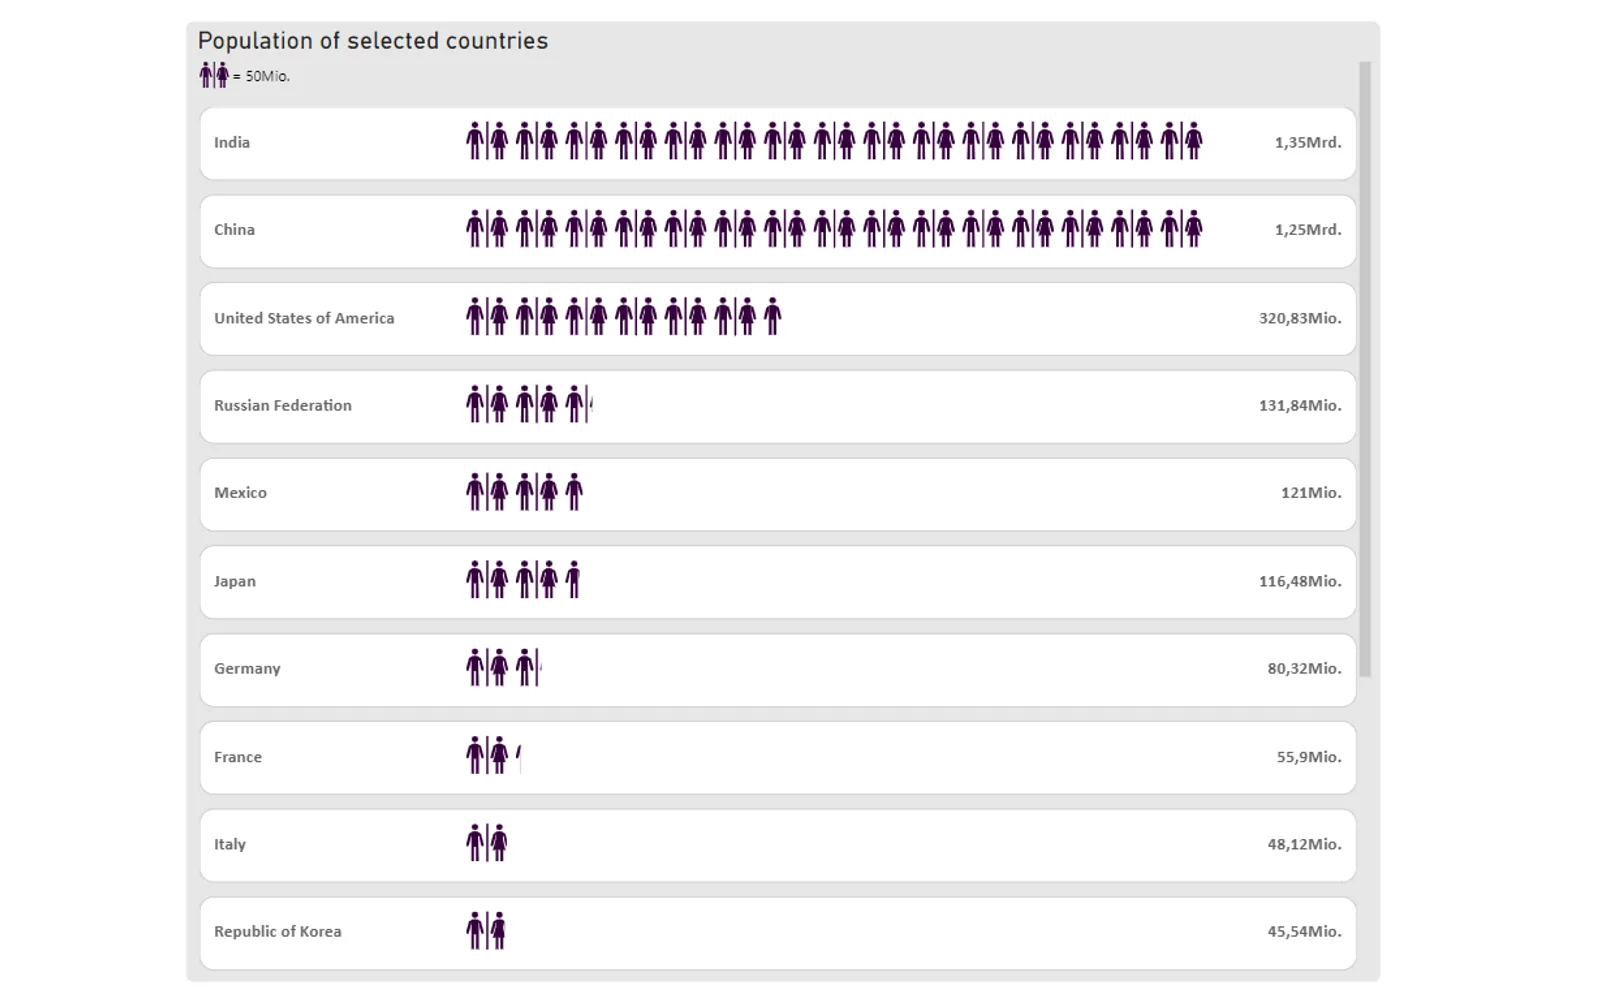
Symbol Chart creates infographic-style charts in Power BI using symbols and icons. It includes predefined symbols and supports imported custom symbols. Charts can use categories or multiples, with horizontal or vertical layouts, color legends, formatting controls, rotation, and adjustable flow direction.
Includes more than 80 predefined symbols for chart creation.
Supports importing custom symbols for use in charts.
Creates charts that represent data with real-world icons.
Supports single charts and charts arranged by categories or multiples.
Allows interactive selection of multiples or categories.
Aligns charts vertically or horizontally within the layout area.
Rotates symbols in 90-degree steps.
Provides an adjustable direction for chart flow.
Symbol Chart is free, while Dual Y-Axis Combo Chart (Pro) for Power BI and Dual Y-Axis Combo Chart (Standard) are freemium. All three list cloud deployment. Symbol Chart was updated on Apr 2026, compared with Feb 2026 for the Pro listing and Dec 2025 for the Standard listing. PureViz Infographic - for PowerPoint to Power BI is paid and cloud deployed, with an update date of Apr 2024.
| Name | Pricing | Deployment | Updated |
|---|---|---|---|
| this plugin | Free | Cloud | |
| Dual Y-Axis Combo Chart (Pro) for Power BI | Freemium | Cloud | |
| Dual Y-Axis Combo Chart (Standard) | Freemium | Cloud | |
| PureViz Infographic - for PowerPoint to Power BI | Paid | Cloud |
657 plugins in Power BI · Analytics
Price distribution: 73 free, 108 freemium, 441 paid, 35 price not published
Combines column, line, area, and scatter charts on dual Y-axes to compare up to 8 metrics in a single Power BI visual.
PBIVizEdit.com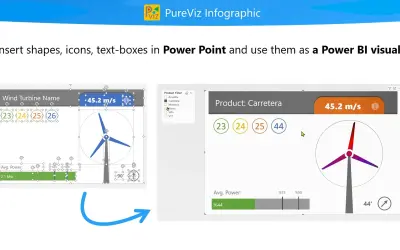
Imports PowerPoint-designed SVG graphics into Power BI and binds data to text, colors, and attributes of shapes.
IntellectBI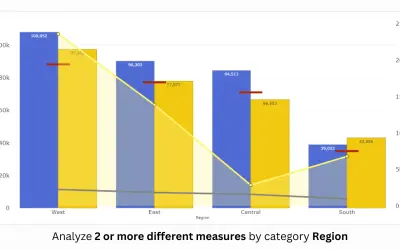
PBIVizEdit custom visual for Power BI that builds dual y-axis charts combining line, area, scatter, and column series.
PBIVizEdit.com
Sign up for a Free Developer License and get 1 year access to this and 20+ ZoomCharts visuals for use in Power BI Desktop!
ZoomCharts«Symbol Chart is a versatile and powerful Power BI visual for creating infographic‑style charts that connect data to real‑world objects through meaningful symbols and icons. Choose from a wide range of pre‑installed symbols or import your own to build rich, expressive infographic visuals. Combined with extensive …»