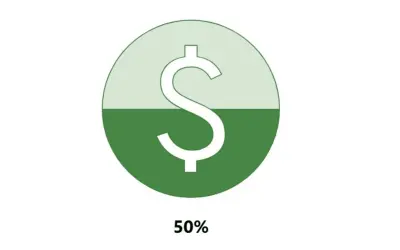
Progress Icon
Power BI custom visual that fills an SVG icon to show KPI progress toward a target instead of a plain number on a card.
NeenOpal IncPaid
Shows KPI progress against goals in Power BI using a configurable temperature-scale visual.
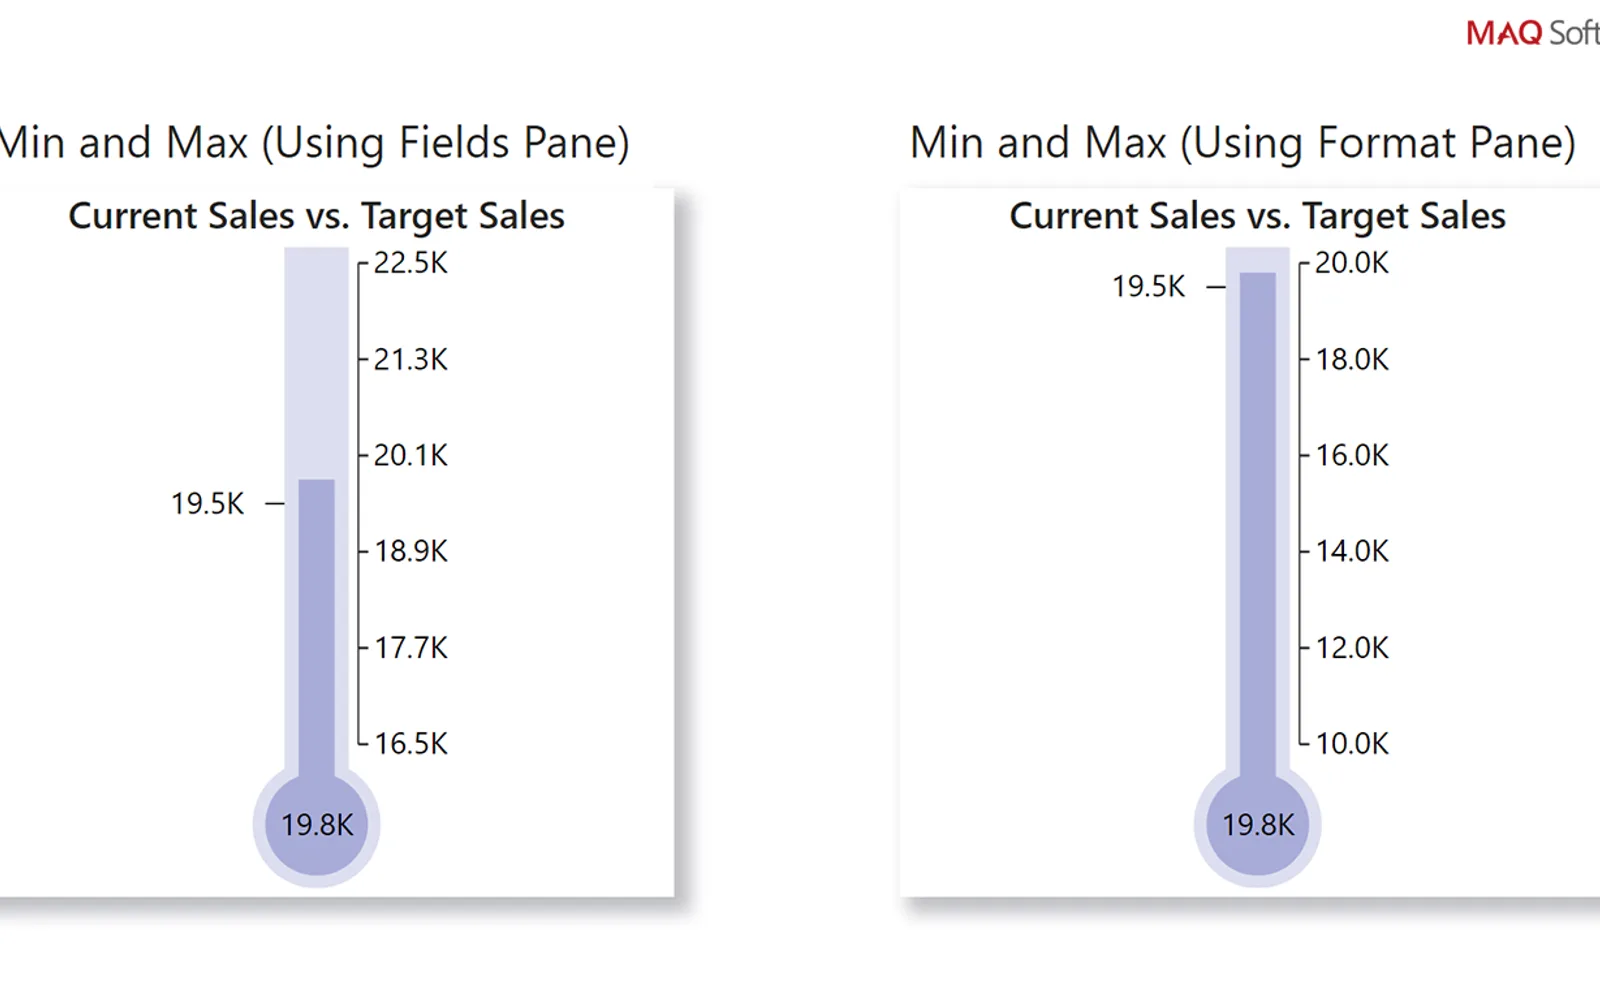
Thermometer displays KPI performance in a temperature-style view for Power BI. It places actual values, thresholds, and targets on one scale. Settings cover colors, scale boundaries, tick-bar visibility, labels, axes, and multiple scale values.
The visual supports separate fill and border color choices.
Minimum and maximum values can define the scale range.
The tick bar can be shown or hidden.
Formatting settings are available for scale labels and values.
The temperature scale can display multiple values for targets and thresholds.
Manufacturing, human resources, sales, and operations teams.
Thermometer by MAQ Software is free and cloud deployed, while Progress Icon is paid and cloud deployed. Drill Down Combo PRO (Pin) by ZoomCharts and Drill Down Combo Bar PRO (Filter) by ZoomCharts are freemium and cloud deployed.
| Name | Pricing | Deployment | Updated |
|---|---|---|---|
| this plugin | Free | Cloud | |
| Progress Icon | Paid | Cloud | |
| Drill Down Combo PRO (Pin) by ZoomCharts | Freemium | Cloud | |
| Drill Down Combo Bar PRO (Filter) by ZoomCharts | Freemium | Cloud |
657 plugins in Power BI · Analytics
Price distribution: 73 free, 108 freemium, 441 paid, 35 price not published
Power BI custom visual that fills an SVG icon to show KPI progress toward a target instead of a plain number on a card.
NeenOpal Inc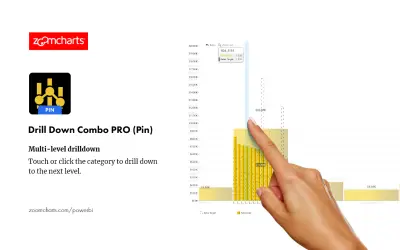
Adds column, line, and area chart types per series to Power BI dashboards, with stacking, clustering, and thresholds.
ZoomCharts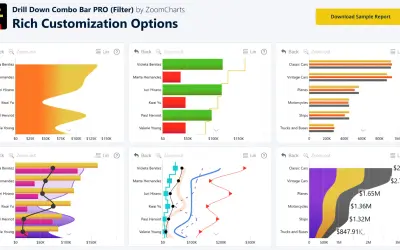
Sign up for a Free Developer License and get 1 year access to this and 20+ ZoomCharts visuals for use in Power BI Desktop!
ZoomCharts
Gantt Chart is a project management visual for Microsoft Power BI that tracks schedules, milestones, and resource workloads.
ChartPad«Track KPI performance instantly with Thermometer by MAQ Software. Designed to highlight progress against goals in a simple, familiar format, this visual makes it easy to monitor actuals, thresholds, and targets in a single view. Business Uses: • Manufacturing - Track inventory levels, throughput, rate of return …»