
Gantt Chart
Gantt Chart is a project management visual for Microsoft Power BI that tracks schedules, milestones, and resource workloads.
ChartPadFree
Create stacked charts in Power BI with grouped legend items, bar highlights, and arrows showing deviations.
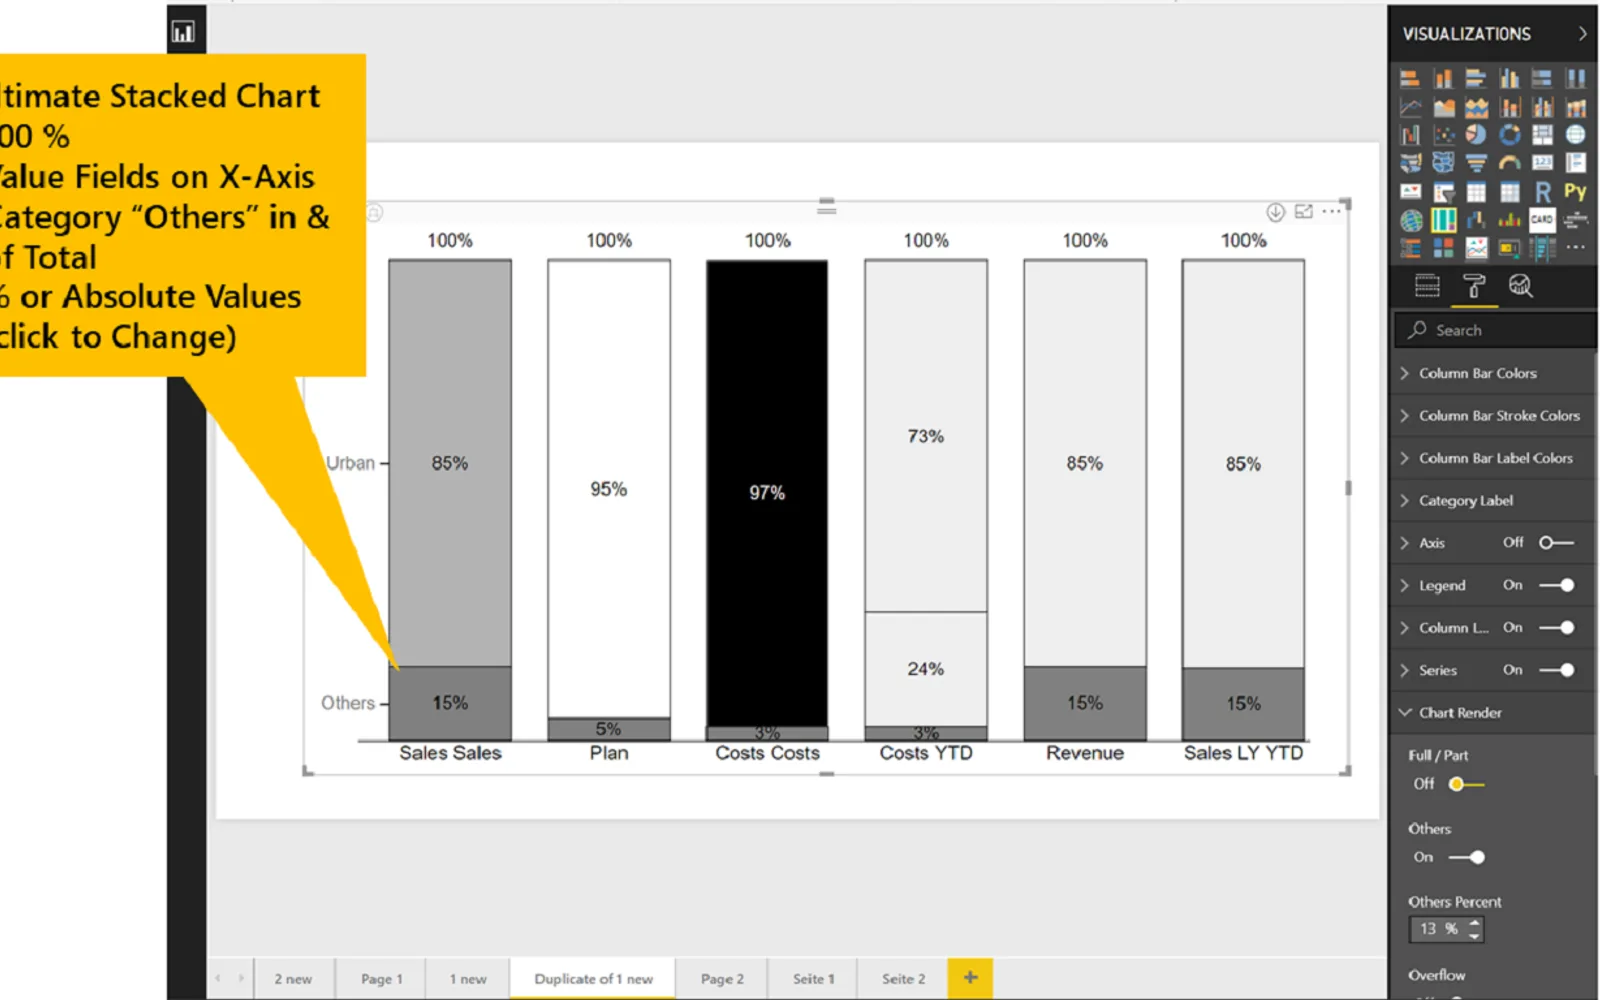
Adds a stacked chart for Power BI with IBCS support, legend grouping, highlights between bars, and deviation calculations. The listing also includes a line chart and a basic highlighted bar chart at no charge.
The chart includes support for IBCS.
Legend items can be grouped into an “others” category.
The chart can display highlights between bars.
Arrows can mark deviations in diagrams.
2,531 plugins in Power BI · Analytics
Price distribution: 125 free, 147 freemium, 1,350 paid, 909 price not published
Gantt Chart is a project management visual for Microsoft Power BI that tracks schedules, milestones, and resource workloads.
ChartPad
Creates visualizations from diverse chart types, combines multiple charts on one canvas, and adds custom annotations and tooltips.
Akvelon
Creates financial and business reports in Power BI with automatic variance calculations, P&L logic, and drill-down (s5, s6).
Zebra BI
AI analysis app for Dynamics 365 Business Central that provides customer KPIs, churn probability, and customer grouping.
Data Courage«The Ultimate Stacked Chart supports IBCS (R). It as a powerful Legend, you can group elements to "others". I supports Data Highlights between bars and deviation calculation as well. The Line Chart and a basic bar chart with Highlight are free. To remove the Watermark, order your Trial License: license@dataviz.boutique …»