
Gantt Chart
Gantt Chart is a project management visual for Microsoft Power BI that tracks schedules, milestones, and resource workloads.
ChartPadFree
Compare two measures in Power BI with column or bar charts that use separate colors for their variance.
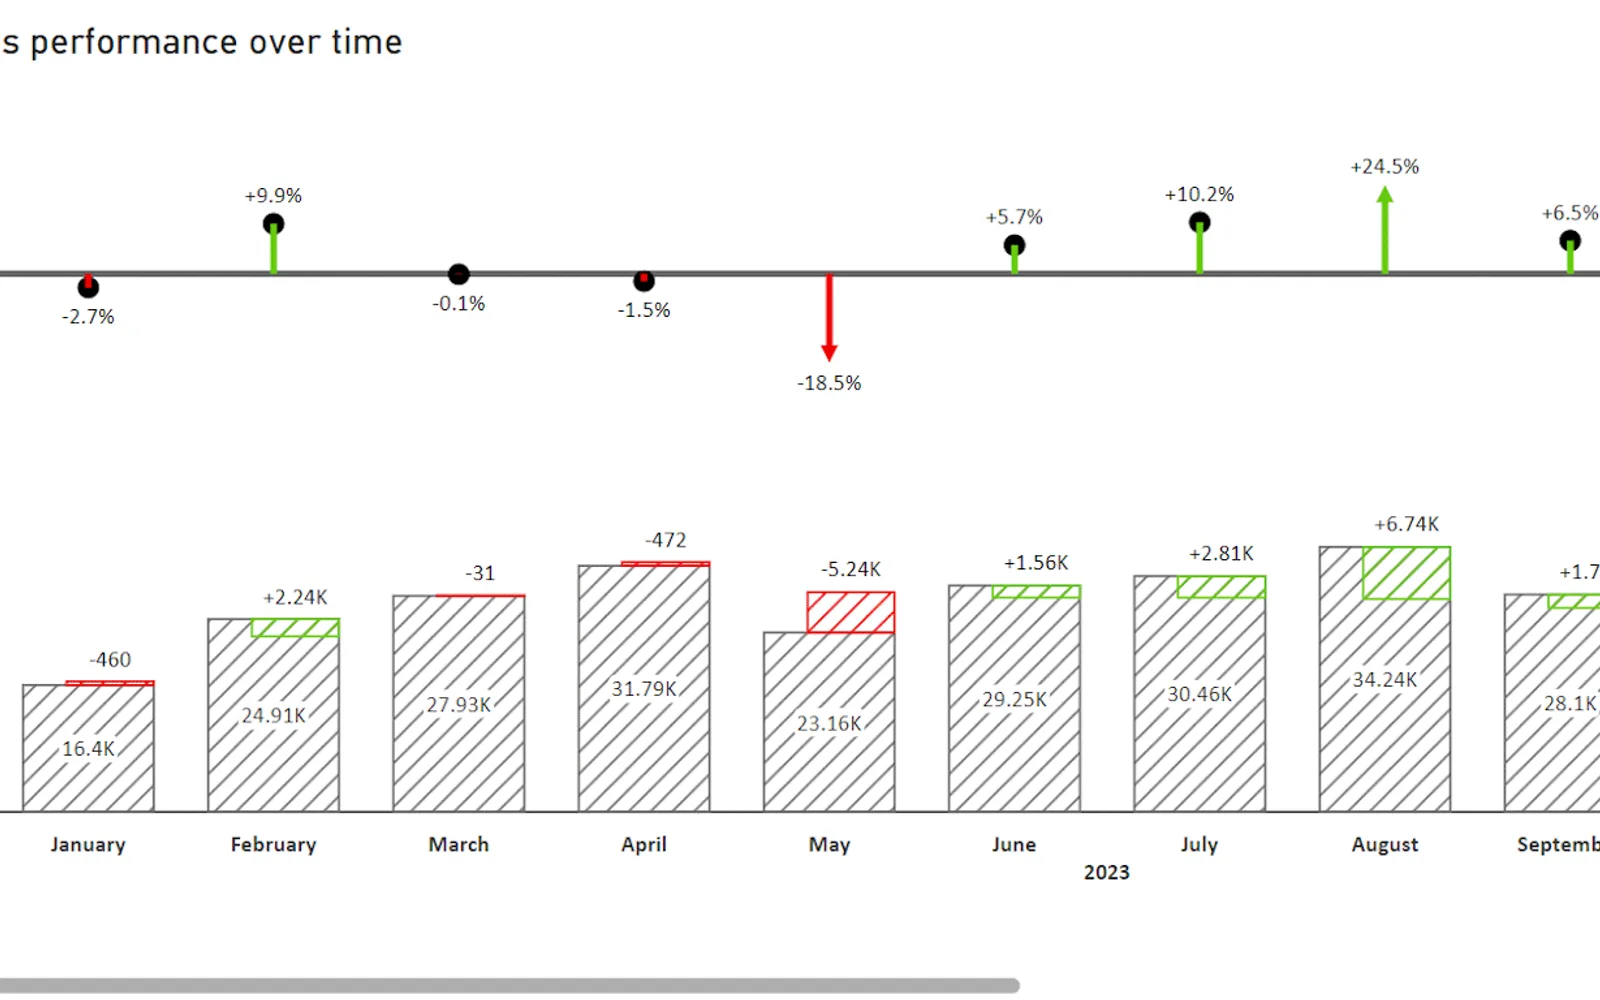
Creates column and bar charts for comparing measures such as actual results and targets. Percentage figures can appear in an optional lollipop chart, while drill operations can show hierarchy groups. The visual handles negative values and selected IBCS requirements, including striped columns. It also supports separate value-type formatting, alternate sorting, indicator color settings, and label or layout adjustments.
Presents comparisons between two measures as either columns or horizontal bars.
Can add a lollipop display for percentage figures.
Shows hierarchy groups during drill operations.
Displays measures that contain negative values.
Includes selected IBCS requirements such as striped columns.
Provides configurable indicator colors and a reverse-indicator setting.
Formats value types separately, including forecast periods.
Uses an extra hidden measure for a different sorting order.
2,531 plugins in Power BI · Analytics
Price distribution: 125 free, 147 freemium, 1,350 paid, 909 price not published
Gantt Chart is a project management visual for Microsoft Power BI that tracks schedules, milestones, and resource workloads.
ChartPad
Creates visualizations from diverse chart types, combines multiple charts on one canvas, and adds custom annotations and tooltips.
Akvelon
Creates financial and business reports in Power BI with automatic variance calculations, P&L logic, and drill-down (s5, s6).
Zebra BI
AI analysis app for Dynamics 365 Business Central that provides customer KPIs, churn probability, and customer grouping.
Data Courage«With Variance Chart, you can create professional column or bar charts that visualize the difference between two measures—such as actual vs. target—as clearly separated, color‑coded areas based on IBCS® (International Business Communication Standards). Key features: • Two chart types available: column or bar • Optional …»