
Bullet Chart - xViz
Power BI visual for comparing actuals against targets, with IBCS-certified bullet chart templates and comparison bands.
xViz LLC dba LumelFreemium
Build number- or percentage-based waffle charts in Microsoft Power BI, with category ordering, colors, display units, and cross-filtering.
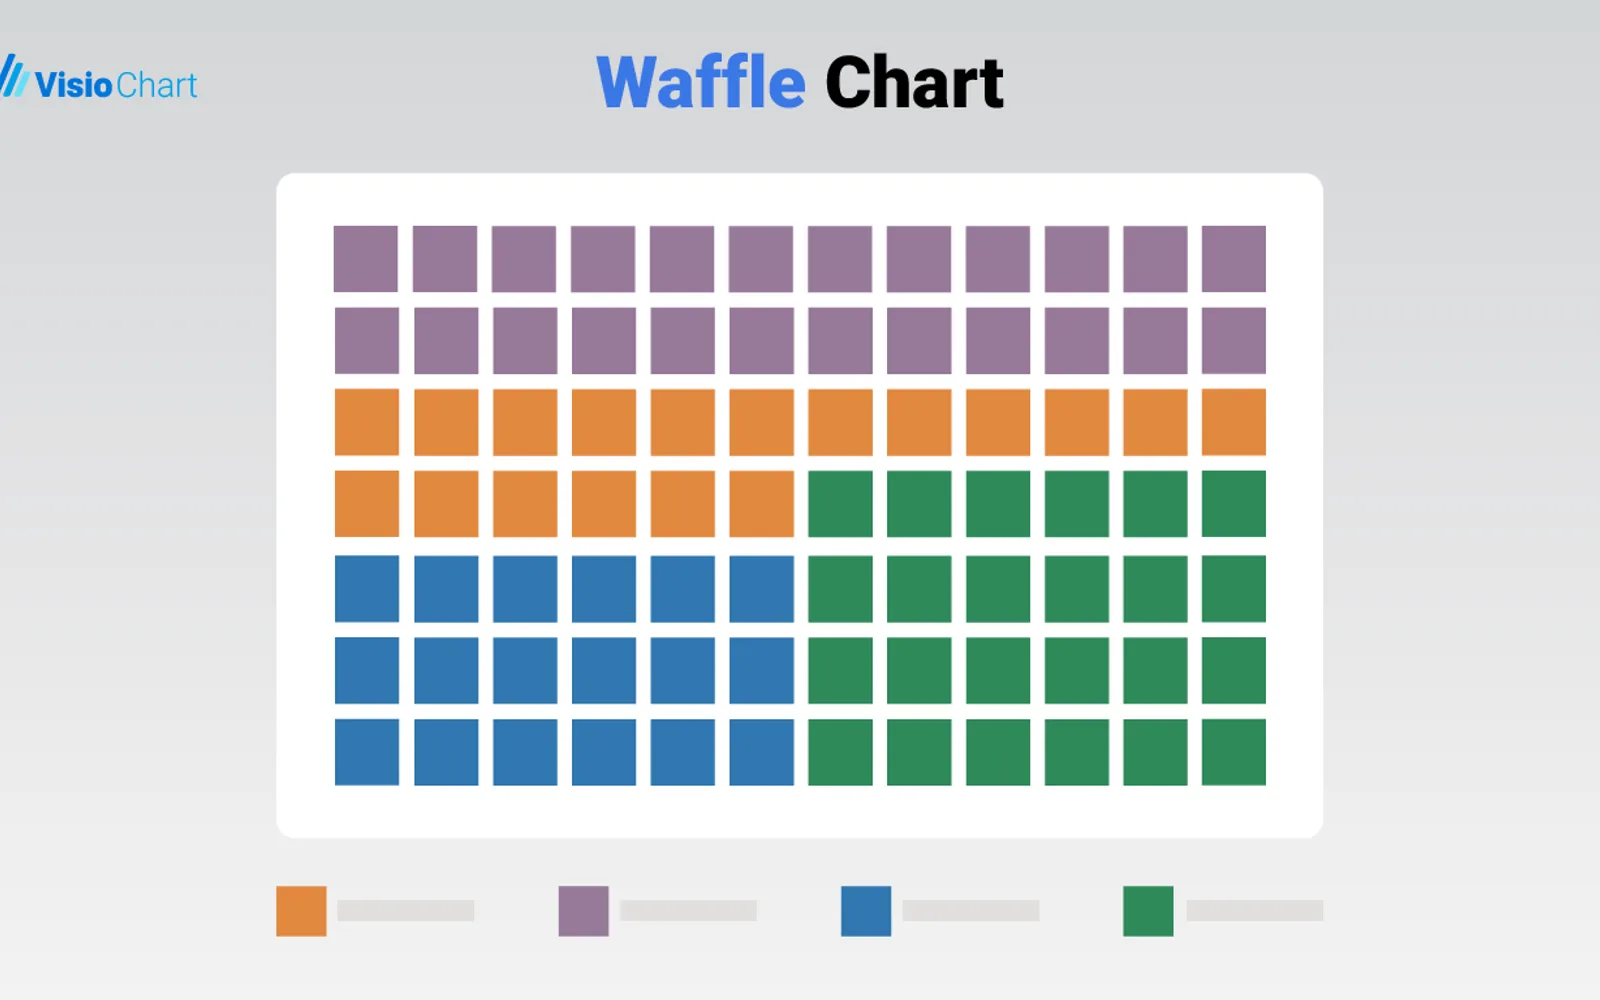
The add-in presents data as a waffle-style grid, with cells representing measurement units. It supports charts based on either numeric values or percentages. Data can be ordered by category, measure, or sort-index column in ascending or descending order. Category colors and value units can be changed, and selecting a category can filter other report visuals.
Builds waffle charts from numeric values or percentages.
Orders chart data upward or downward by category, measure, or sort-index column.
Lets each category receive a selected color.
Allows value displays to use units such as thousands, millions, or percentages.
A category selection can filter related visualizations in the same report.
Waffle Chart Maker is free, while Bullet Chart - xViz and Funnel/Pyramid Chart - xViz are freemium, and PieChart by iFour is paid. All listed products use cloud deployment. Waffle Chart Maker was updated on Dec 2025; Bullet Chart - xViz, Funnel/Pyramid Chart - xViz, and Advanced Pie and Donut - xViz were updated in Dec 2025, while PieChart by iFour was updated in Nov 2025.
| Name | Pricing | Deployment | Updated |
|---|---|---|---|
| this plugin | Free | Cloud | |
| Waffle Chart | Paid | Cloud | |
| Bullet Chart - xViz | Freemium | Cloud | |
| Funnel/Pyramid Chart - xViz | Freemium | Cloud | |
| PieChart by iFour | Paid | Cloud | |
| Advanced Pie and Donut - xViz | Freemium | Cloud |
657 plugins in Power BI · Analytics
Price distribution: 73 free, 108 freemium, 441 paid, 35 price not published
Power BI visual for comparing actuals against targets, with IBCS-certified bullet chart templates and comparison bands.
xViz LLC dba Lumel
PieChart by iFour divides data into colored slices to visualize parts-to-whole relationships within Power BI reports.
iFour Technolab Pvt. Ltd.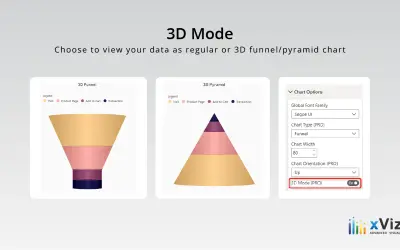
xViz Funnel/Pyramid Chart displays process stages and hierarchies with configurable 2D or 3D views for Power BI reports.
xViz LLC dba Lumel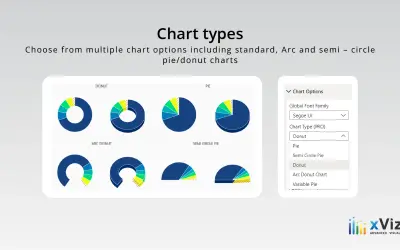
An xViz pie and donut chart for Power BI that compares parameters and displays each part's proportion of the whole.
xViz LLC dba Lumel«Waffle Chart Maker for Microsoft Power BI by VisioChart In the realm of data visualization, presenting information in a clear, compelling, and easily interpretable manner is paramount. Microsoft Power BI, a leading business analytics tool, offers an array of visualization options. Among these, the Waffle Chart by …»