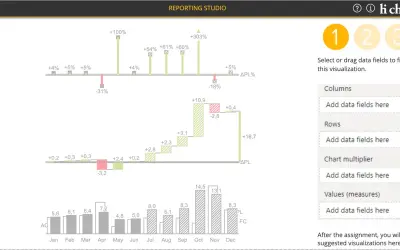
hi-chart Reporting Studio
Creates charts, tables and waterfalls in Power BI with a built-in notation concept and automatic variance calculation.
CP Corporate Planning GmbHFreemium
Compares Power BI values with budgets, forecasts, targets, or prior-year references in variance charts.
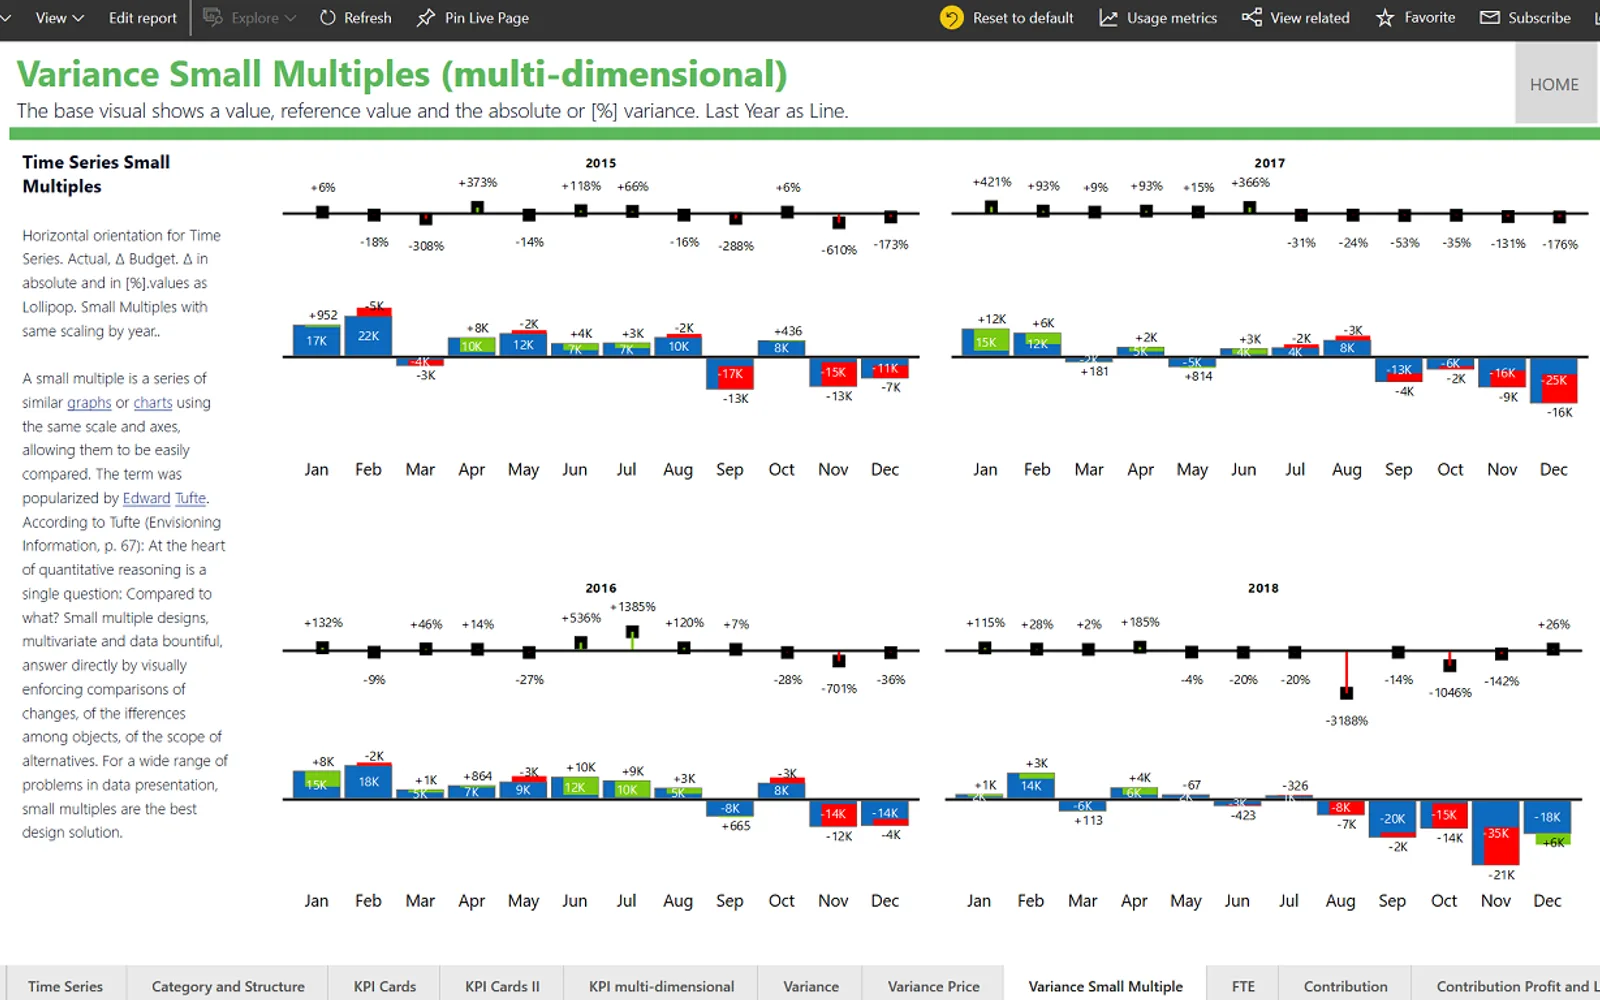
Displays a measured value beside a selected reference value in Power BI, with the difference represented in the same view. Additional charts can show absolute or percentage variance. The visual supports horizontal and vertical layouts, plus individual charts or small-multiple views for categories, regions, products, or business units. A watermark can be removed for an extra charge.
Compares values with a budget, forecast, target, or previous-year reference.
Adds a chart for the numerical difference between values.
Adds a chart for the difference expressed as a percentage.
Shows chart views separately for categories, regions, products, or business units.
Provides horizontal layouts for time series and vertical layouts for categories.
Ultimate Variance is free, while hi-chart Reporting Studio, Bullet Chart - xViz, Innofalls Charts, and Dual Y-Axis Combo Chart (Pro) for Power BI are freemium. Arineo D365 Finance-Dashboard is paid. Every listed alternative uses cloud deployment, as does Ultimate Variance; the alternatives have update dates of Dec 2025, Aug 2026, or Feb 2026.
| Name | Pricing | Deployment | Updated |
|---|---|---|---|
| this plugin | Free | Cloud | |
| hi-chart Reporting Studio | Freemium | Cloud | |
| Bullet Chart - xViz | Freemium | Cloud | |
| Innofalls Charts | Freemium | Cloud | |
| Dual Y-Axis Combo Chart (Pro) for Power BI | Freemium | Cloud | |
| Arineo D365 Finance-Dashboard | Paid | Cloud |
657 plugins in Power BI · Analytics
Price distribution: 73 free, 108 freemium, 441 paid, 35 price not published
Creates charts, tables and waterfalls in Power BI with a built-in notation concept and automatic variance calculation.
CP Corporate Planning GmbH
Power BI visual for comparing actuals against targets, with IBCS-certified bullet chart templates and comparison bands.
xViz LLC dba Lumel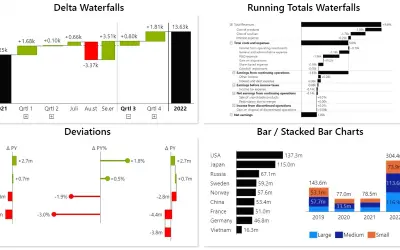
Power BI visual for building waterfall and bar charts through interactive navigation, drill downs, and dynamic comparisons.
Innofalls GmbH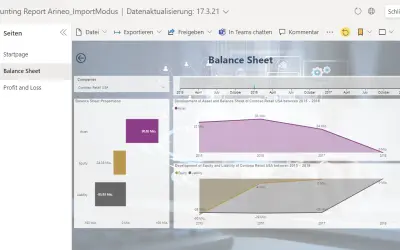
Visualizes Dynamics 365 Finance balance sheet and P&L figures in a Power BI dashboard with drill-down to individual accounts.
Arineo GmbH«Power BI Variance Chart with Small Multiples and IBCS®-Inspired Design Build clear and professional variance reports in Power BI with a flexible custom visual for comparing values against reference values such as budget, forecast, target, or previous year. The base chart displays **value, reference value, and …»