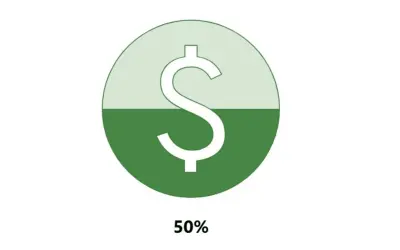
Progress Icon
Power BI custom visual that fills an SVG icon to show KPI progress toward a target instead of a plain number on a card.
NeenOpal IncPaid
Display icons in Power BI when values meet defined conditions or contain data errors.
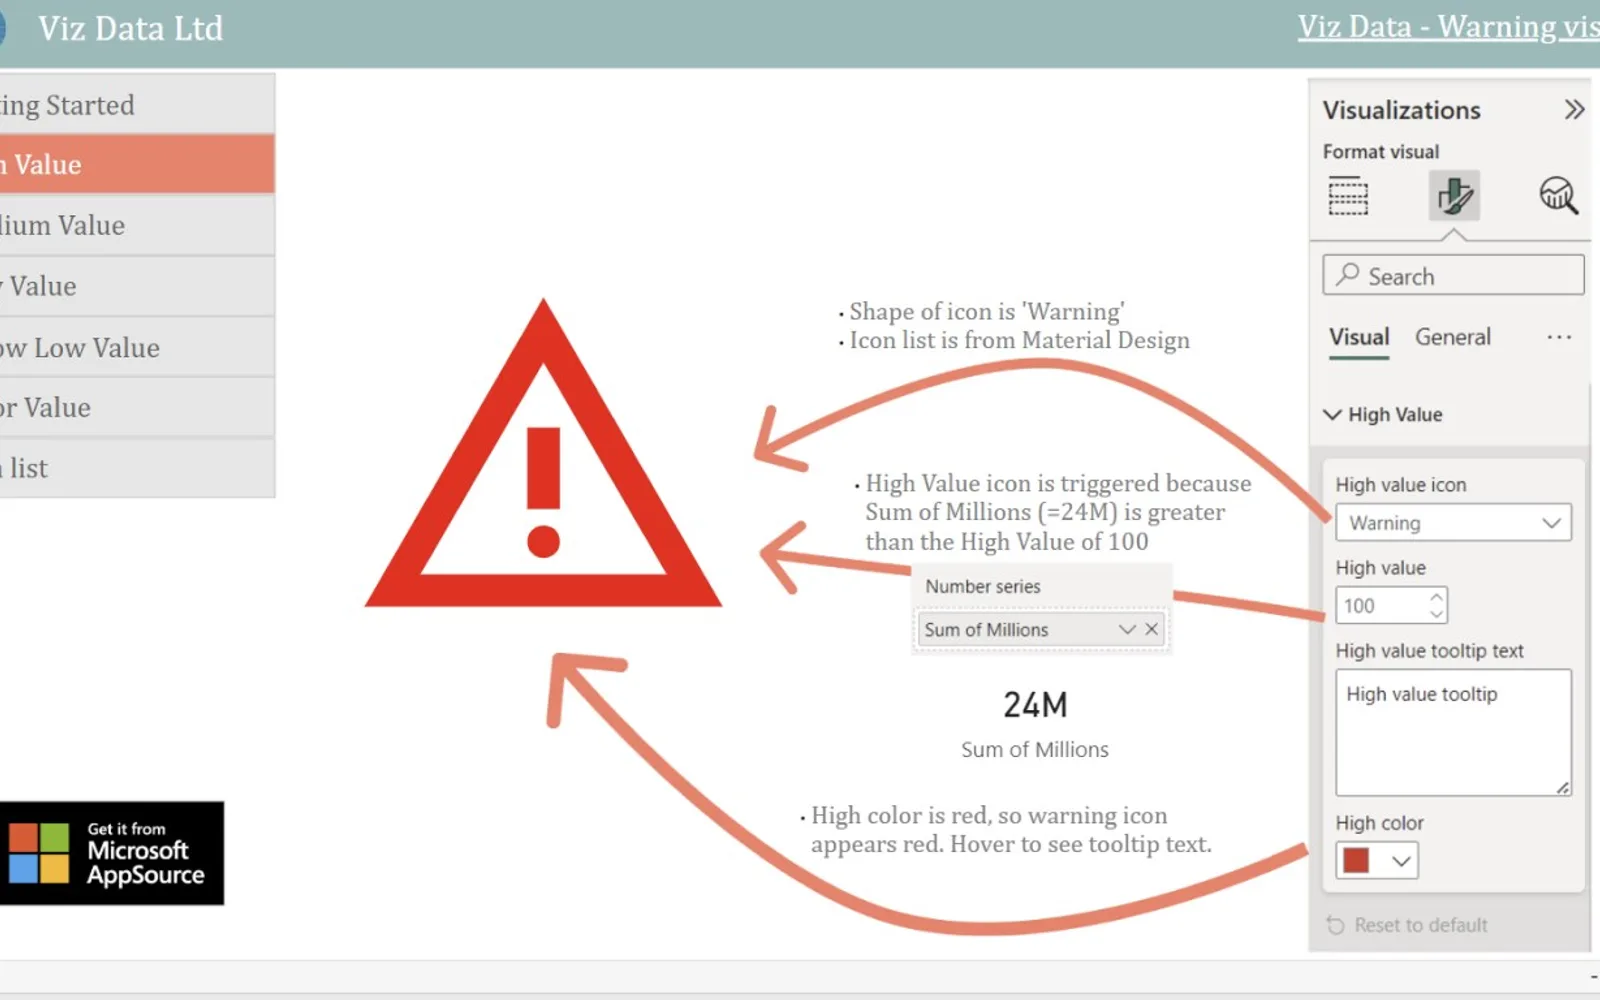
Warning displays an icon in Power BI when data meets defined conditions. It supports up to three icons for different number ranges and an icon for data errors. The visual provides 14 icon choices and lets users add explanations in the formatting pane.
Displays an icon when data meets a defined condition.
Supports up to three icons for different number ranges.
Provides an icon option for errors in the data.
Offers 14 icons for flagging risks, achievements, or trends.
Lets users add explanations in the formatting pane.
Warning is free, while Progress Icon is paid. Both use cloud deployment. Warning was updated on Dec 2025, while Progress Icon lists an update date of May 2026.
| Name | Pricing | Deployment | Updated |
|---|---|---|---|
| this plugin | Free | Cloud | |
| Progress Icon | Paid | Cloud |
744 plugins in Power BI · Analytics
Price distribution: 74 free, 110 freemium, 451 paid, 109 price not published
Power BI custom visual that fills an SVG icon to show KPI progress toward a target instead of a plain number on a card.
NeenOpal Inc
Gantt Chart is a project management visual for Microsoft Power BI that tracks schedules, milestones, and resource workloads.
ChartPad
Creates visualizations from diverse chart types, combines multiple charts on one canvas, and adds custom annotations and tooltips.
Akvelon
Creates financial and business reports in Power BI with automatic variance calculations, P&L logic, and drill-down (s5, s6).
Zebra BI«Highlight key insights with dynamic warning icons Warning helps flag important data points for your users by displaying an icon only when specific conditions are met. Instead of cluttering your report with unnecessary alerts, Warning preserves space by appearing only when values reach critical thresholds. For example …»