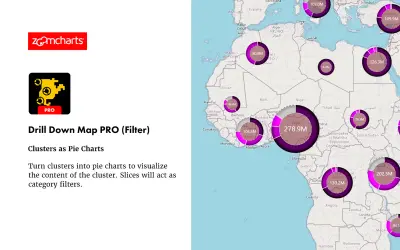
Drill Down Map PRO (Filter) by ZoomCharts
Drill Down Map PRO (Filter) by ZoomCharts visualizes and filters location data on interactive maps for Power BI Desktop reports.
ZoomChartsFreemium
Create layered geographic visualizations, custom boundaries, and route charts in Power BI.
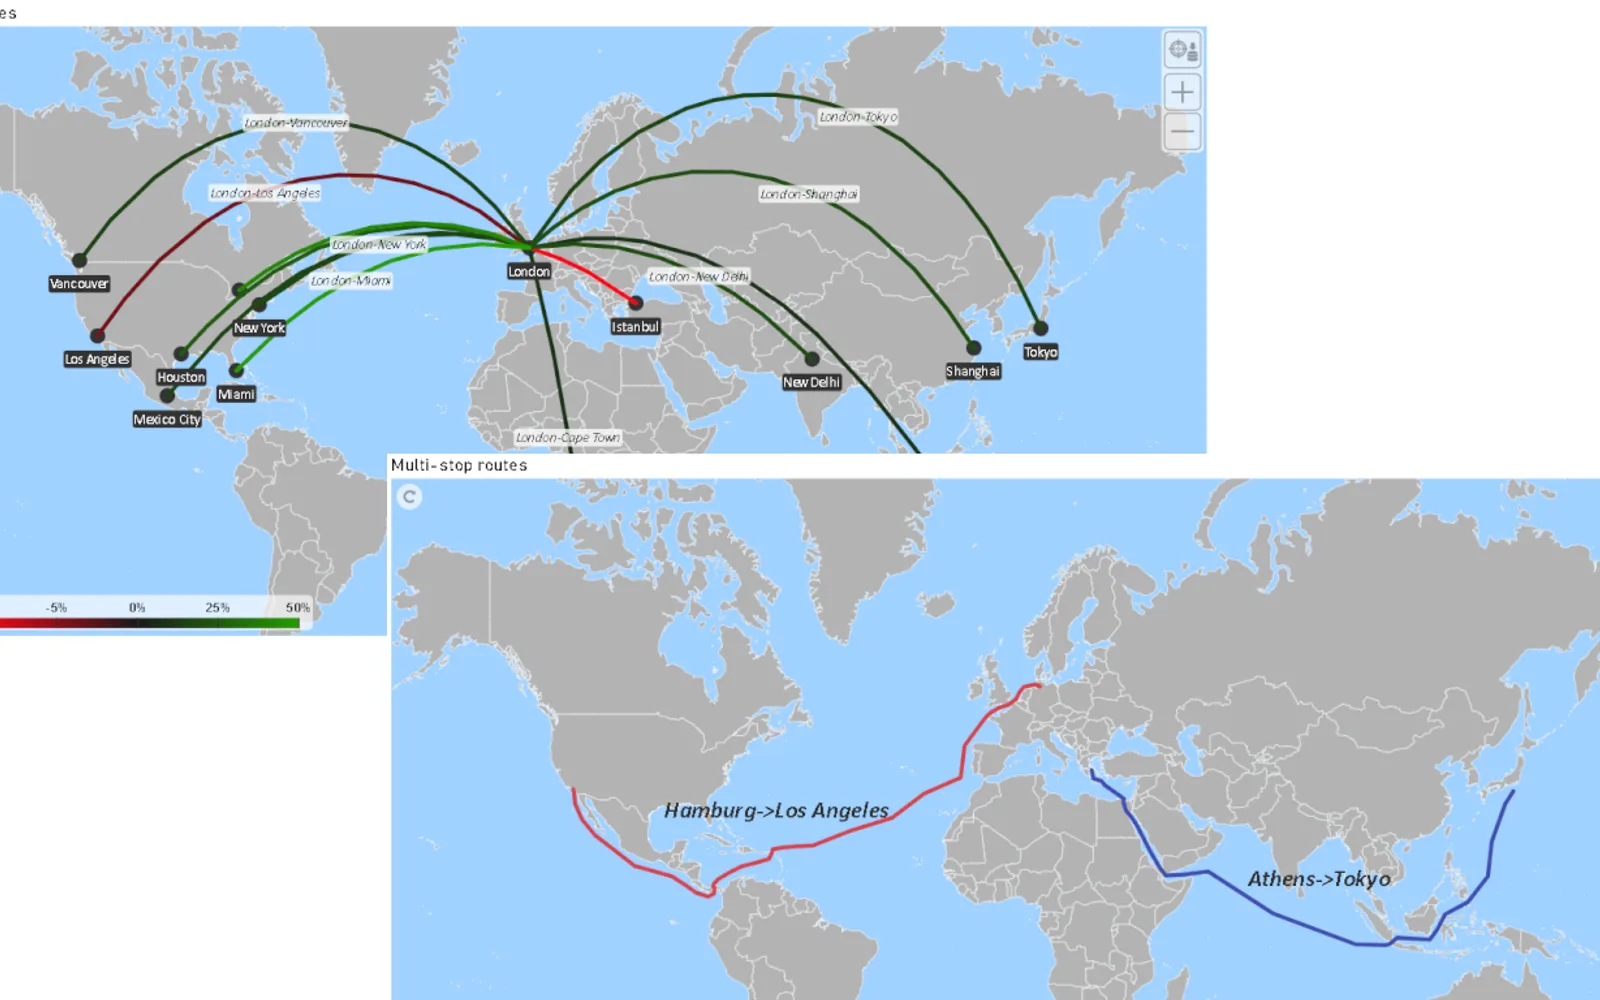
Maps adds geographic visualizations to Power BI, including shaded areas, points, paths, bubbles, images, and animated flow lines. It imports GeoJSON and TopoJSON boundaries for use in maps. Column, line, pie, donut, and packed-bubble charts can appear on locations, paths, or areas. Navigation includes panning, zooming, rotation, drilling, centering, and selection.
Imports GeoJSON and TopoJSON shapes, regions, and boundaries into Power BI.
Places column, line, pie, donut, or packed-bubble charts on points, routes, or shapes.
Displays directional flows and routes with configurable moving dashlines.
Supports panning, zooming, rotation, drilling, automatic centering, and selection.
Includes more than 200 offline maps and multiple projections.
Provides category colors, scale options, multi-field labels, and customizable drill paths.
657 plugins in Power BI · Analytics
Price distribution: 73 free, 108 freemium, 441 paid, 35 price not published
Drill Down Map PRO (Filter) by ZoomCharts visualizes and filters location data on interactive maps for Power BI Desktop reports.
ZoomCharts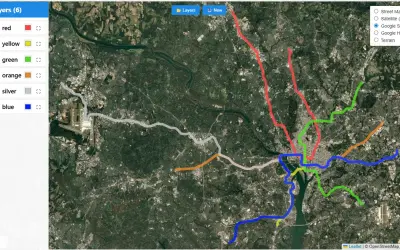
KML/KMZ Viewer renders points, lines, and polygons from KML and KMZ files on interactive maps within Power BI reports.
Abdalla Dabes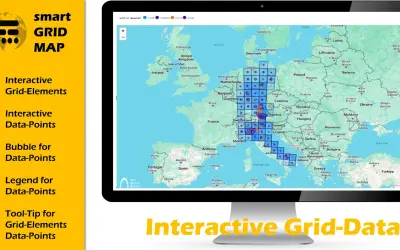
Smart Grid-Map is a custom Power BI visual for visualizing and analyzing grid and raster data with interactive polygons.
The Green Bridge GmbH
Power BI visual for tracking supply chain, sales, and financial performance with interactive diagrams, alerts, and KPIs.
xViz LLC dba Lumel«Maps – Your Geospatial Power BI Visual Explore your data with Maps, the intelligent and versatile visual for geospatial analytics in Power BI. New Highlights • Custom map upload (GeoJSON & TopoJSON): Bring your own shapes, regions, and boundaries into Power BI with full formatting support. • True mini‑charts on the …»