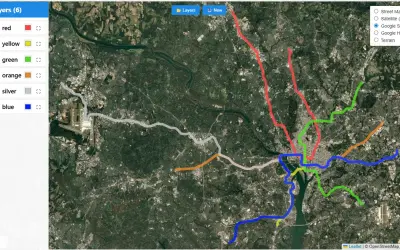
kml-kmz-visual
KML/KMZ Viewer renders points, lines, and polygons from KML and KMZ files on interactive maps within Power BI reports.
Abdalla DabesPaid
Visualizes raster and grid data in Microsoft Power BI with interactive polygons, centroids, and geospatial styling.
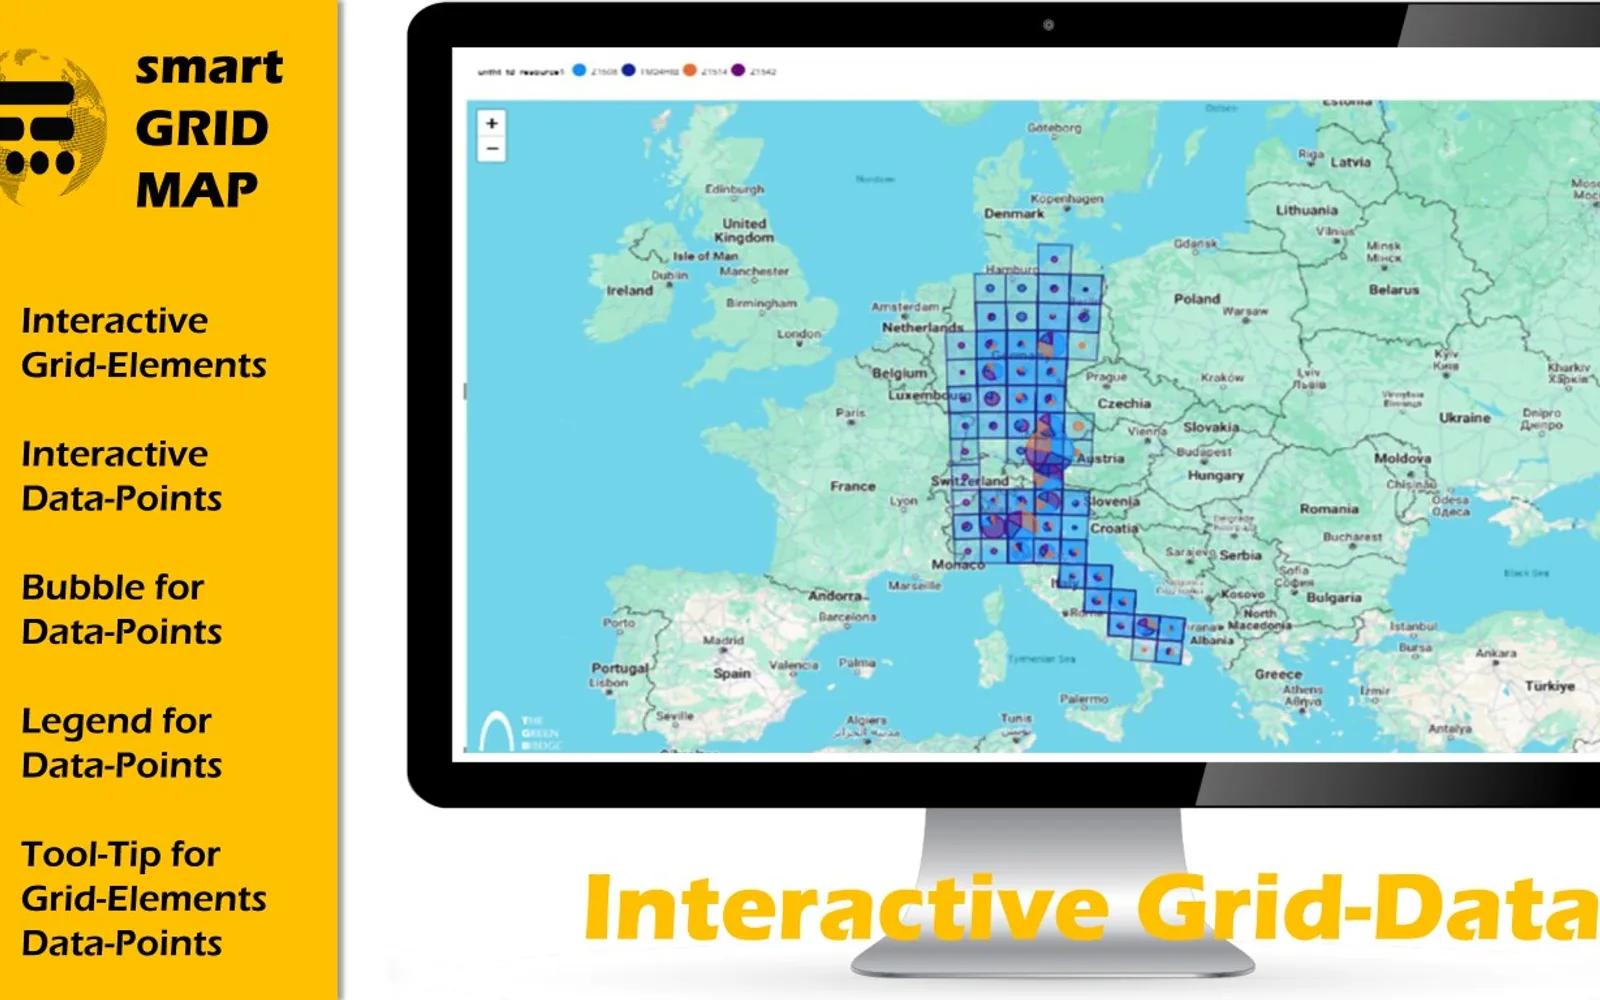
Smart Grid-Map visualizes raster and grid data in Microsoft Power BI. It creates square or quadrilateral polygons from corner points and can display centroids on top of the polygons. Inputs include centroids, four corner points, legends, bubble size, and tooltips. Styling options include colors, transparency, and display style.
Displays raster and grid data in Microsoft Power BI.
Creates square or quadrilateral polygons from four corner points.
Shows latitude and longitude centroids on top of polygons.
Accepts centroids, polygon corner points, legends, bubble sizes, tooltips, and four-point shapes.
Supports customizable colors, transparency, and style.
Uses WGS84 as the input coordinate system.
GIS users and people working with grid-related data.
657 plugins in Power BI · Analytics
Price distribution: 73 free, 108 freemium, 441 paid, 35 price not published
KML/KMZ Viewer renders points, lines, and polygons from KML and KMZ files on interactive maps within Power BI reports.
Abdalla Dabes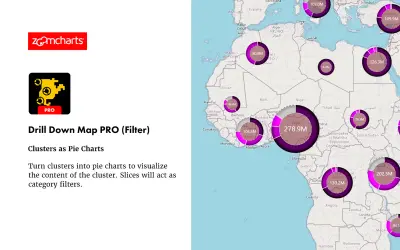
Drill Down Map PRO (Filter) by ZoomCharts visualizes and filters location data on interactive maps for Power BI Desktop reports.
ZoomCharts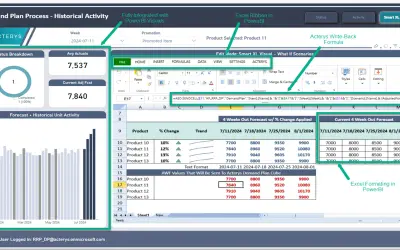
Acterys Smart XL enables Excel-like cell-based reporting, planning forms, and data writeback directly within Power BI.
Managility
Gantt Chart is a project management visual for Microsoft Power BI that tracks schedules, milestones, and resource workloads.
ChartPad«This custom map is ideal for any Global Information System (GIS) or any other user who has data related to Grids. No more complex post-processing, It delivers very easy and performant data visualization with all capabilities of Microsoft Power BI for data interactivity and data analytics. The easiest way to visualize …»