Drill Down Map PRO (Filter) by ZoomCharts
Drill Down Map PRO (Filter) by ZoomCharts visualizes and filters location data on interactive maps for Power BI Desktop reports.
ZoomChartsFreemium
KML/KMZ mapping inside Power BI reports with interactive maps, layers, feature styling, and map view controls.
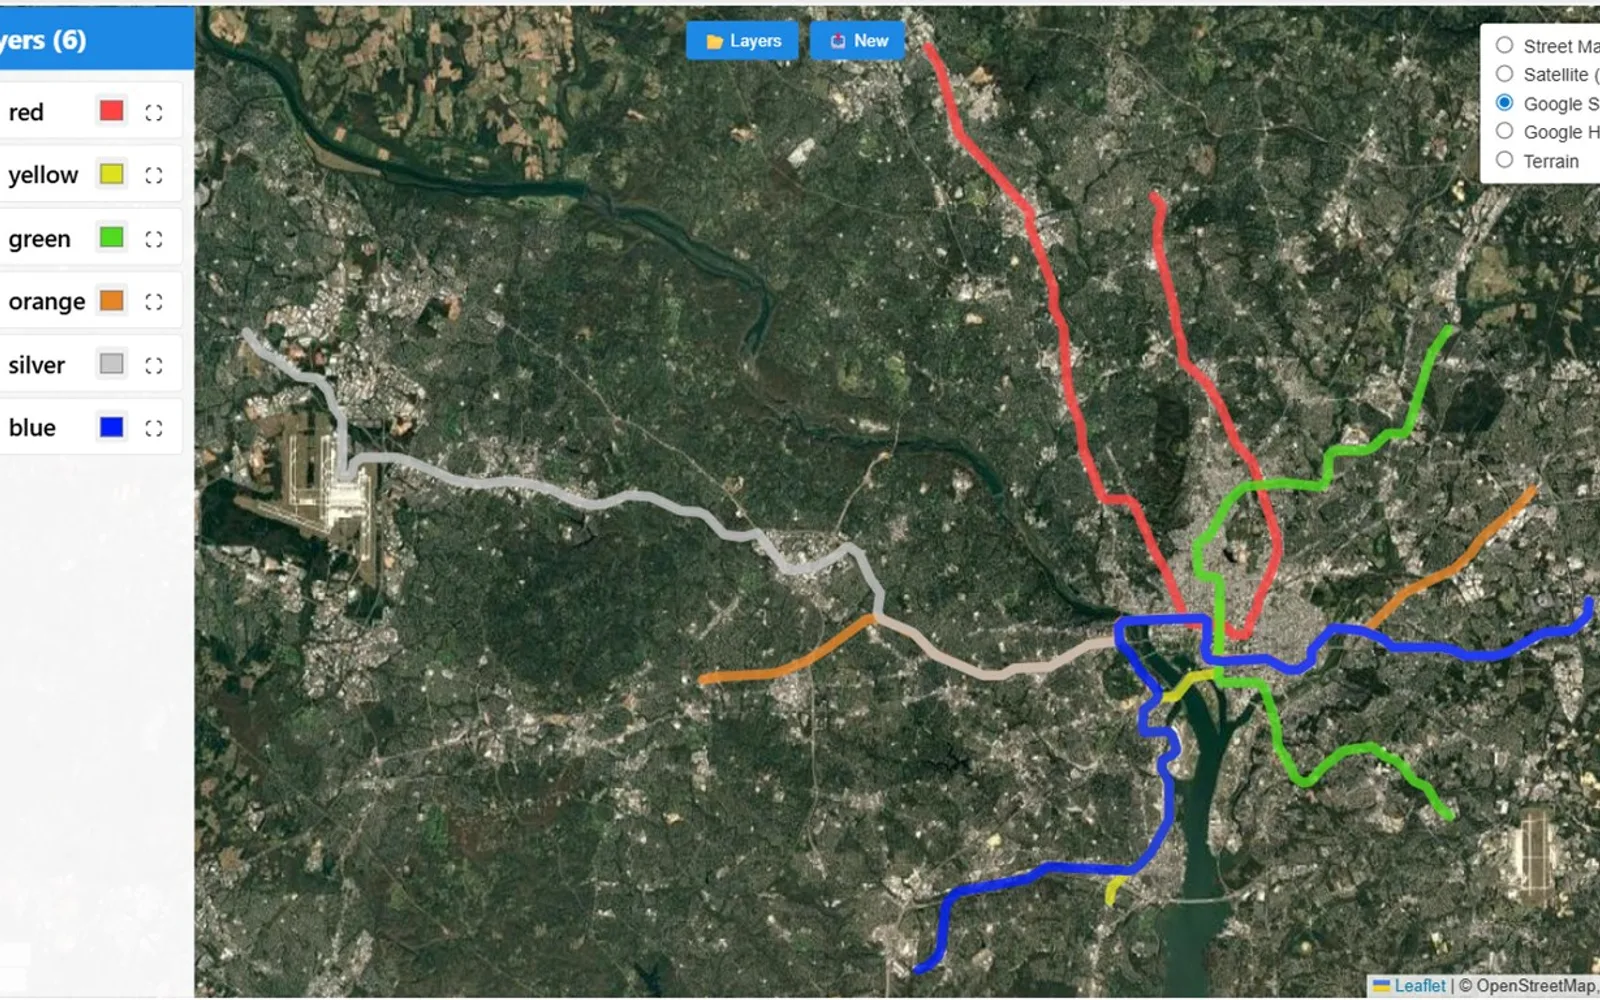
Imports KML and KMZ files into Power BI and displays their points, lines, and polygons on interactive maps. Map controls support panning, zooming, and several map views, including Street, Satellite, Google Satellite, Google Hybrid, and Terrain. Features can be shown or hidden, recolored, and adjusted from 1-10 pixels in line or border thickness. Customizations and settings are saved automatically.
Uploads KML or KMZ files for display in Power BI.
Supports panning, zooming, and exploration of geospatial data.
Provides Street, Satellite, Google Satellite, Google Hybrid, and Terrain views.
Lists map features in a panel with show and hide controls for each item.
Changes the color of individual features.
Adjusts line and border thickness from 1-10 pixels.
Zooms to individual features or fits all features in view.
Saves customizations, colors, and settings automatically.
KML/KMZ Viewer is paid and cloud deployed, while Drill Down Map PRO (Filter) by ZoomCharts and Smart Grid-Map are freemium and cloud deployed. KML/KMZ Viewer was updated on Feb 2026, compared with Aug 2026 for Drill Down Map PRO (Filter) by ZoomCharts and Dec 2025 for Smart Grid-Map.
| Name | Pricing | Deployment | Updated |
|---|---|---|---|
| this plugin | Paid | Cloud | |
| Viewer | Paid | Desktop | |
| Drill Down Map PRO (Filter) by ZoomCharts | Freemium | Cloud | |
| Smart Grid-Map | Freemium | Cloud |
657 plugins in Power BI · Analytics
Price distribution: 73 free, 108 freemium, 441 paid, 35 price not published
Drill Down Map PRO (Filter) by ZoomCharts visualizes and filters location data on interactive maps for Power BI Desktop reports.
ZoomCharts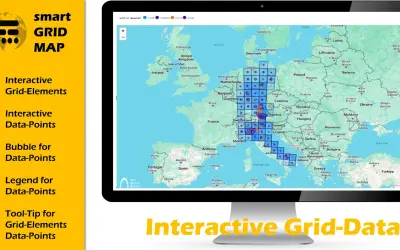
Smart Grid-Map is a custom Power BI visual for visualizing and analyzing grid and raster data with interactive polygons.
The Green Bridge GmbH
Gantt Chart is a project management visual for Microsoft Power BI that tracks schedules, milestones, and resource workloads.
ChartPad
Creates visualizations from diverse chart types, combines multiple charts on one canvas, and adds custom annotations and tooltips.
Akvelon«KML/KMZ Viewer - Professional Geospatial Data Visualization for Power BI Transform your location data into interactive maps directly within your Power BI reports. The KML/KMZ Viewer makes it easy to visualize geographic information without external tools. Key Features: Easy File Import - Simply upload KML or KMZ files …»